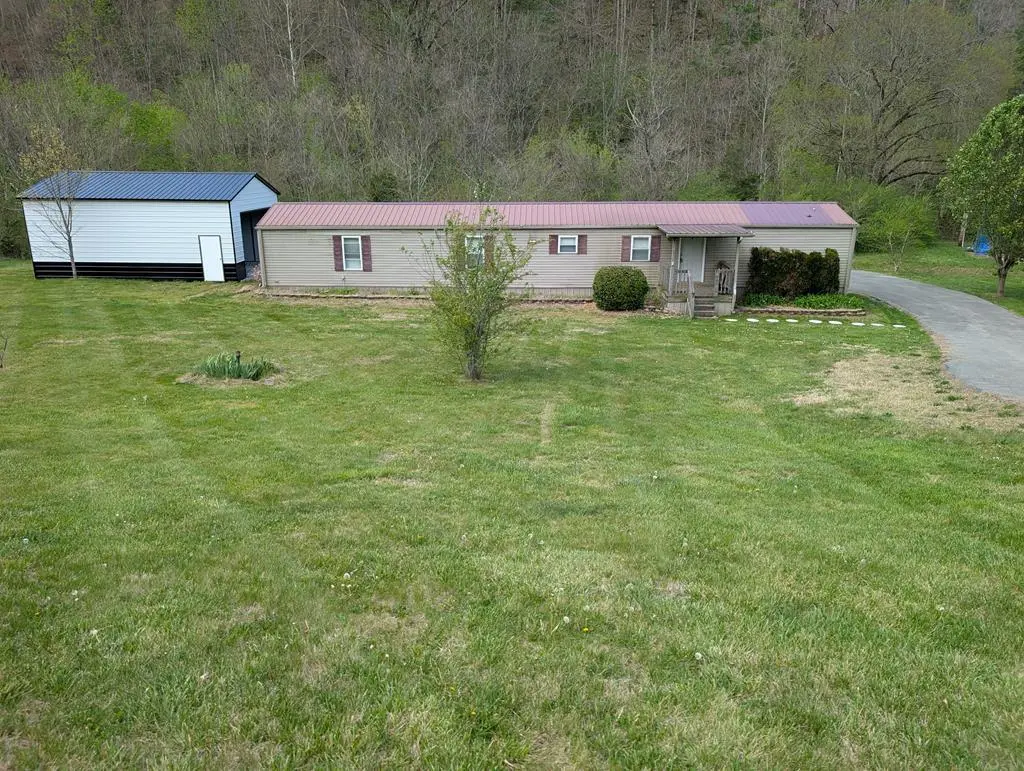
3580 Celina Rd
Burkesville, KY 42717
$124,000D+
3 bd · 2.0 ba ·
1,280 sqft ·
Built 1999
· Other
· Active
· 75 DOM
Cashflow @ list (25.0% down · 7.5%)
Estimated rent
$1,113/mo
Mortgage (P&I)
−$650
Tax + insurance
−$273
HOA
−$0
Vac / Maint / Mgmt
−$234
Net cashflow
$-44/mo
Annual
$-534/yr
Cap rate
6.51%
Cash-on-cash
0.76%
DSCR
1.03
1% rule
0.90%
Cash to close
$34,720
Investor read
- This is a 3-bed/2.0-bath other listed at $124k.
- At list price, monthly cash flow is $-44 ($-534/yr) — negative.
- To cash-flow at today's rent, offer at most $118k (5.2% below list).
- To meet the 1% rule (rent ≥ 1% of price), the offer needs to be $111k (10.3% below list).
- It's been on market 75 days — a 6% lower offer ($117k) is reasonable based on typical stale-listing flexibility.
- Recommended offer: $111k (10.3% below list) — sets the bar for 1% rule.
- Local home prices are declining (-3.0%/yr); year-one equity from $857 of loan paydown is wiped out by about $4k of value loss. Plan a longer hold.
- Location reads 68/100 on livability (#186 in KY) — a middle-class / working-renter tenant base. Strengths: crime A+, cost of living A+, health & safety A+; Watch: amenities F, commute F, employment F.
- Cumberland County (rural): math 32% / reading 42% proficiency, ranked #60 of 165 in KY (top 36%) — families likely to look elsewhere, expect single-tenant / working-renter base with shorter leases; 63% free/reduced lunch — lower-income household profile, screen leases tightly.
- Zoned schools: Cumberland County Elementary School (math 38% / reading 38%, grade F, #242 of 676 statewide, top 37%, 503 students, 80% FRL); Cumberland County Middle School (math 29% / reading 45%, grade F, #80 of 217 statewide, top 41%, 206 students, 71% FRL); Cumberland County High School (math 22% / reading 47%, grade F, #76 of 254 statewide, top 34%, 295 students, 68% FRL).
- Watch-outs: flood insurance adds $66/mo.
- Market conditions: 147 active listings in the ZIP.
- Cumberland County population projected at -20% by 2050 — secular population decline; favor cash flow + early exit over multi-decade hold.
- 2 sale attempts with the ask held roughly flat each time — persistent listings suggest the price (not the market) is what's stuck; bring a comps-based counter.
- Current owner paid $52k; list at $124k implies a 138% gain — meaningful room to come down on a strong offer.
- Climate carrying-cost: severe flood risk; moderate wildfire risk; extreme-heat days projected 7→21/yr by 2055 (HVAC capex compounding) — expect insurance premiums to compound above CPI over the hold.
Questions for listing agent
- What do current leases actually rent for vs. the listed asking? Can we see a recent rent roll and the last 12 months of T-12 income?
- It's been on market 75 days. Have you received any prior offers? Is the seller open to a 10% concession, seller financing, or rate buy-down credit?
- What's the actual annual flood-insurance premium (NFIP or private), and is the property in a SFHA with mandatory coverage?
- Why hasn't it sold? Are there any deal-killer items the seller is aware of (foundation, flood, title, zoning, code violations)?
- Is there a deadline driving the sale (1031 exchange, divorce, estate, relocation)? That informs how much negotiation room exists.
- Schools are D-rated, which usually means shorter tenancies and higher turnover. Who's the typical renter profile here, and what's been the actual vacancy rate?
- The area grade is low — what's the realistic commute time and amenity access for the typical tenant pool here? Any planned neighborhood developments (good or bad) we should know about?
- What's the average days-on-market for RENTAL listings here right now (not sales)? A rising rental-DOM trend means longer vacancies and softer asking-rent achievability than the comps imply.
CashFlowRE · CFR-DM2W6D6QQ8SWXT
· Data 7 h ago
cashflowre.app · 2026-05-29