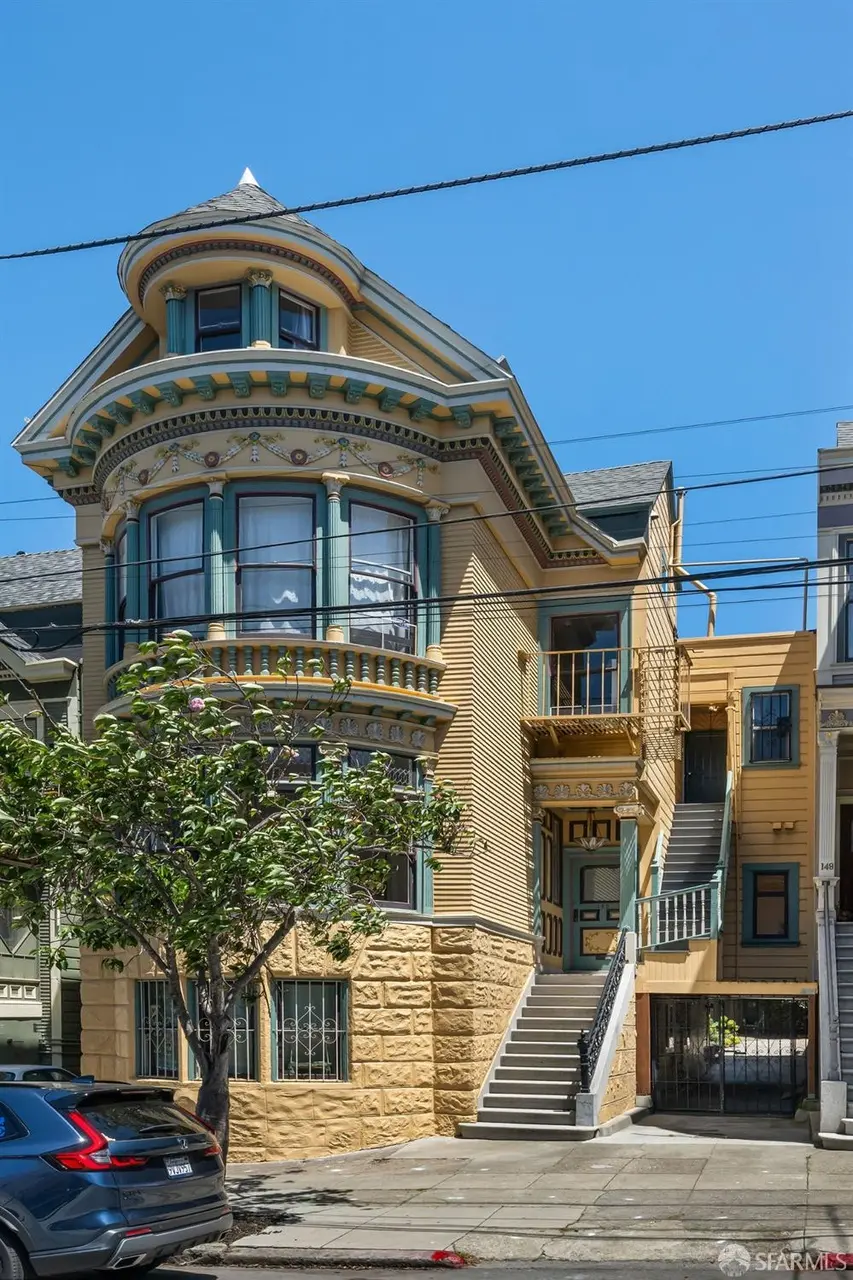
150 Central Ave Unit 1/2
San Francisco, CA 94117
$680,000C-
2 bd · 1.0 ba ·
930 sqft ·
Built 1906
· SingleFamily
· Active
· 27 DOM
Cashflow @ list (25.0% down · 7.5%)
Estimated rent
$4,658/mo
Mortgage (P&I)
−$3,566
Tax + insurance
−$1,133
HOA
−$0
Vac / Maint / Mgmt
−$978
Net cashflow
$-1,020/mo
Annual
$-12,236/yr
Cap rate
4.49%
Cash-on-cash
-6.43%
DSCR
0.71
1% rule
0.68%
Cash to close
$190,400
Investor read
- This is a 2-bed/1.0-bath single-family listed at $680k.
- At list price, monthly cash flow is $-1k ($-12k/yr) — negative.
- To cash-flow at today's rent, offer at most $532k (21.7% below list).
- To meet the 1% rule (rent ≥ 1% of price), the offer needs to be $466k (31.5% below list).
- It's been on market 27 days — a 2% lower offer ($670k) is reasonable based on typical stale-listing flexibility.
- Recommended offer: $466k (31.5% below list) — sets the bar for 1% rule.
- In year one you build about $68k of equity ($5k loan paydown + $63k appreciation (9.3% local appreciation)).
- Location reads 76/100 on livability (#90 in CA, #3,143 nationally) — a middle-class / working-renter tenant base. Strengths: amenities A+, commute A+, employment A+; Watch: crime F, cost of living F.
- San Francisco Unified (urban): math 50% / reading 56% proficiency, ranked #322 of 1,400 in CA (top 23%) — acceptable for families but not a draw, mixed tenant base, ~2y average lease.
- Zoned schools: Lilienthal (Claire) Elementary (669 students, 19% FRL); Giannini (A.P.) Middle (1,192 students, 34% FRL); Lowell High (2,632 students, 37% FRL) — zoned schools average 30% FRL vs 49% district-wide (19 pts lower); this property's tenant base skews higher-income than the district average.
- Watch-outs: built in 1906 — expect roof / HVAC / electrical / plumbing capex.
- Market conditions: Rents rising fast (+18.2%/yr); 74 active listings in the ZIP; 40 comparable units currently listed for rent nearby; rentals at typical pace (median 22d on market — plan ~3-4 weeks tenant-placement turnaround); high-income renter base; 750 units permitted in San Francisco County in 2024 (688 in 5+ unit buildings).
- San Francisco County population projected at +39% by 2050 — long-run rental-demand tailwind backs the buy-and-hold thesis.
- By year 2, paydown + projected appreciation supports a ~$109k cash-out refi (75% LTV) — recoverable capital for the next deal without selling this one.
- Cap rate 4.5% vs local median 2.1% in San Francisco — top-decile yield for the area; either an underpriced asset or a hidden risk that comps aren't pricing in. Stress-test before assuming the spread holds.
- This rent runs 33% of the median local income ($167k/yr) — at the standard rent-burdened threshold; future hikes will face affordability resistance.
Questions for listing agent
- What do current leases actually rent for vs. the listed asking? Can we see a recent rent roll and the last 12 months of T-12 income?
- Built in 1906 — when were the roof, HVAC, electrical panel, plumbing, and water heater last replaced?
- Is there a deadline driving the sale (1031 exchange, divorce, estate, relocation)? That informs how much negotiation room exists.
- Schools are B-rated — typically a magnet for longer-tenancy family renters. What's the average tenant stay here, and is there a school-zone premium baked into asking?
- Crime grade is F in this area — have there been break-ins, vandalism, or insurance claims at this property in the last 3 years? What carrier currently insures it and at what premium?
- What's the average days-on-market for RENTAL listings here right now (not sales)? A rising rental-DOM trend means longer vacancies and softer asking-rent achievability than the comps imply.
- What's the recent tenant-quality profile in this submarket — average credit score on applications, eviction rate, late-payment / NSF rate, and stable-employment percentage? A property-management company in the area should have these aggregated.
- How much new for-sale + rental construction is in the pipeline within 1–3 miles? Heavy new supply typically softens prices + rents 12–24 months out; constrained supply supports both.
CashFlowRE · CFR-DN73MY48RWH99W
· Data 1 day ago
cashflowre.app · 2026-05-29