150 Central Ave Unit 1/2 · San Francisco, CA
Flood risk 1/10 · Minimal
- FEMA flood zone
- X (unshaded)
- Chance of flooding over 30 yrs
- 0.0%
- Est. flood insurance / yr
- $473 – $860
Fire risk 1/10 · Minimal
- Est. fire insurance / yr
- $659 – $1,223
Heat risk 2/10 · Minimal
- Hot days now (above 76°F)
- 7 days/yr
- Hot days in 30 yrs
- 17 days/yr
Wind risk 1/10 · Minimal
- Chance of severe wind over 30 yrs
- —
Air-quality risk 8/10 · Major
- Unhealthy air days now
- 15 days/yr
- Unhealthy air days in 30 yrs
- 15 days/yr
Risk factors via First Street. Map © Google.
Why this score? — see what drove the C- grade
The composite is a weighted blend of 9 inputs, each scored 0–100. Each bar is that input's sub-score; the figure is the points it added to the 100-point composite (weight × sub-score).
- ARV discount +15.0/15.0
- Appreciation +9.6/10.0
- Cash flow +6.9/30.0
- Rent growth +5.0/5.0
- Schools +5.0/10.0
- Livability +3.8/5.0
- Condition / age +2.5/5.0
- 1% rule +1.8/10.0
- DSCR +1.1/10.0
$680,000
🖨 Deal sheet (PDF) 📄 Offer letter ✓ Due diligence
Listing remarks
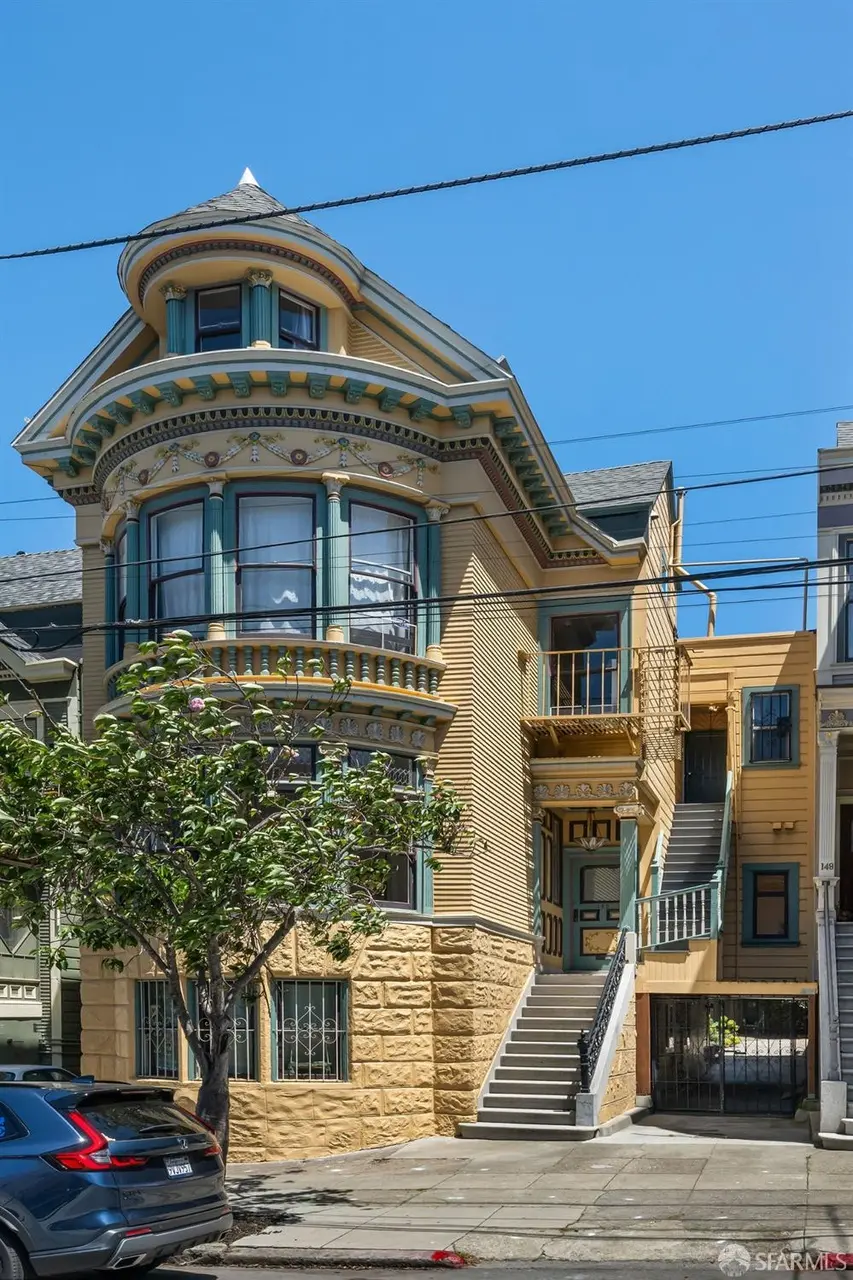
Built in 1906, this quintessential San Francisco Victorian residence blends timeless architectural character with elevated modern living. Located on the garden level, this two-bedroom residence offers an exceptional indoor-outdoor lifestyle with direct walkout access to a private patio and the shared rear garden beyond. Thoughtfully designed with split bedrooms for enhanced privacy and flexibility, the home features well-proportioned rooms, abundant natural light, and an extra-large kitchen with ample space for cooking, gathering, and everyday living. The inviting living room is anchored by charming bay windows that fill the space with natural light and architectural character. An easy, fun
Key facts
- Extra-large kitchen
- Private patio
- Split bedrooms
Tags
Property features AI
Finance
- HOA & community: Part of a 4-unit community; Has homeowners association with no monthly fee
Exterior
- Utilities: Lot elevation at ground level
- Home design: Residential Tenancy-in-Common; Property is attached
- Construction: Built in 1906
- Exterior features: Ground/level entry
Interior
- Bedrooms: 2 bedrooms
- Bathrooms: 1 full bathroom
- Interior features: Entry level is ground/level
Neighborhood map
What this means for you Summary
Snapshot
- This is a 2-bed/1.0-bath single-family listed at $680k.
Deal economics
- At list price, monthly cash flow is $-1k ($-12k/yr) — negative.
- To cash-flow at today's rent, offer at most $532k (21.7% below list).
- To meet the 1% rule (rent ≥ 1% of price), the offer needs to be $466k (31.5% below list).
- Recommended offer: $466k (31.5% below list) — sets the bar for 1% rule.
- Cap rate 4.5% vs local median 2.1% in San Francisco — top-decile yield for the area; either an underpriced asset or a hidden risk that comps aren't pricing in. Stress-test before assuming the spread holds.
Location & tenants
- Location reads 76/100 on livability (#90 in CA, #3,143 nationally) — a middle-class / working-renter tenant base. Strengths: amenities A+, commute A+, employment A+; Watch: crime F, cost of living F.
- San Francisco Unified (urban): math 50% / reading 56% proficiency, ranked #322 of 1,400 in CA (top 23%) — acceptable for families but not a draw, mixed tenant base, ~2y average lease.
- Zoned schools: Lilienthal (Claire) Elementary (669 students, 19% FRL); Giannini (A.P.) Middle (1,192 students, 34% FRL); Lowell High (2,632 students, 37% FRL) — zoned schools average 30% FRL vs 49% district-wide (19 pts lower); this property's tenant base skews higher-income than the district average.
- Market conditions: Rents rising fast (+18.2%/yr); 74 active listings in the ZIP; 40 comparable units currently listed for rent nearby; rentals at typical pace (median 22d on market — plan ~3-4 weeks tenant-placement turnaround); high-income renter base; 750 units permitted in San Francisco County in 2024 (688 in 5+ unit buildings).
- This rent runs 33% of the median local income ($167k/yr) — at the standard rent-burdened threshold; future hikes will face affordability resistance.
Forward outlook
- In year one you build about $68k of equity ($5k loan paydown + $63k appreciation (9.3% local appreciation)).
- San Francisco County population projected at +39% by 2050 — long-run rental-demand tailwind backs the buy-and-hold thesis.
- By year 2, paydown + projected appreciation supports a ~$109k cash-out refi (75% LTV) — recoverable capital for the next deal without selling this one.
Negotiation context
- It's been on market 27 days — a 2% lower offer ($670k) is reasonable based on typical stale-listing flexibility.
Risks & watch-outs
- Watch-outs: built in 1906 — expect roof / HVAC / electrical / plumbing capex.
Questions for the listing agent
- What do current leases actually rent for vs. the listed asking? Can we see a recent rent roll and the last 12 months of T-12 income?
- Built in 1906 — when were the roof, HVAC, electrical panel, plumbing, and water heater last replaced?
- Is there a deadline driving the sale (1031 exchange, divorce, estate, relocation)? That informs how much negotiation room exists.
- Schools are B-rated — typically a magnet for longer-tenancy family renters. What's the average tenant stay here, and is there a school-zone premium baked into asking?
- Crime grade is F in this area — have there been break-ins, vandalism, or insurance claims at this property in the last 3 years? What carrier currently insures it and at what premium?
- What's the average days-on-market for RENTAL listings here right now (not sales)? A rising rental-DOM trend means longer vacancies and softer asking-rent achievability than the comps imply.
- What's the recent tenant-quality profile in this submarket — average credit score on applications, eviction rate, late-payment / NSF rate, and stable-employment percentage? A property-management company in the area should have these aggregated.
- How much new for-sale + rental construction is in the pipeline within 1–3 miles? Heavy new supply typically softens prices + rents 12–24 months out; constrained supply supports both.
Investment metrics
- 1% rule
- 0.68% ✗
- Cap rate
- 4.49%
- Cash-on-cash
- -6.43%
- DSCR
- 0.71
- GRM
- 12.2
CMA / ARV
- ARV (on-the-fly)
- $978,360
- Comps found
- 12
Show comp detail 12 sales within ~0.75 mi
| Address | Dist | Beds/Ba | Sqft | Sold | Price | $/sf | Match |
|---|---|---|---|---|---|---|---|
| 136 Parnassus Ave #4 | 0.58mi | 2/1.5 | 883 (-5%) | 0mo | $1,435,000 | $1,625 | 62 |
| 221 Noe St #6 | 0.69mi | 2/1.0 | 890 (-4%) | 1mo | $1,200,000 | $1,348 | 60 |
| 512 Cole St #512 | 0.36mi | 1/1.0 (-1) | 1,020 (+10%) | 13mo | $900,000 | $882 | 51 |
| 5 Vulcan Stairway | 0.55mi | 1/1.0 (-1) | 815 (-12%) | 3mo | $1,505,000 | $1,847 | 47 |
| 675 Cole St #5 | 0.43mi | 1/1.5 (-1) | 854 (-8%) | 18mo | $735,000 | $861 | 44 |
| 125 Ord St | 0.67mi | 2/1.0 | 1,035 (+11%) | 9mo | $950,000 | $918 | 42 |
| 48 Terra Vista Ave Unit A | 0.74mi | 1/1.0 (-1) | 865 (-7%) | 8mo | $790,000 | $913 | 42 |
| 136 Parnassus Ave #2 | 0.58mi | 2/1.0 | 1,027 (+10%) | 20mo | $1,080,000 | $1,052 | 39 |
| 1261 Grove St #6 | 0.48mi | 2/1.0 | 802 (-14%) | 19mo | $880,000 | $1,097 | 39 |
| 48 Terra Vista Ave Unit B | 0.74mi | 1/1.0 (-1) | 831 (-11%) | 7mo | $715,000 | $860 | 37 |
| 32 Mars St | 0.66mi | 1/2.0 (-1) | 835 (-10%) | 10mo | $1,451,100 | $1,738 | 35 |
| 4648 18th St | 0.72mi | 1/1.0 (-1) | 833 (-10%) | 20mo | $820,000 | $984 | 27 |
Match score weights: distance 35% · size 25% · config 20% · recency 20%. Top-matched comps best support the ARV.
Projected returns pro-forma
9.27% appreciation · 8.0% rent growth · sell at horizon
- IRR
- 19.6%
- Equity multiple
- 2.56×
- Total profit
- $296,478
- Equity at exit
- $576,845
- IRR
- 19.2%
- Equity multiple
- 6.14×
- Total profit
- $977,756
- Equity at exit
- $1,207,809
Cash invested: $190,400 (down + closing). Projections, not guarantees.
Landlord ↔ Tenant lean methodology
- Overall (CITY)
- 0 Strongly Tenant-Friendly
- State California
- 18 Strongly Tenant-Friendly · D+13
- County
- — inherits STATE
- City San Francisco
- 0 Strongly Tenant-Friendly · D+57
ZIP-level market 94117
- Home prices YoY
- 4.2%
- Rents YoY
- 18.2%
- Active inventory
- 74
- Price-to-rent
- 12.2×
Monthly cashflow live
- Estimated rent
- $4,658 high interval (Pro) →
- Mortgage (P&I)
- −$3,566
- Tax est. 1.5%
- −$850 /mo · $10,200/yr
- Insurance
- −$283
- HOA
- −$0
- Vacancy / Maint / Mgmt
- −$978
- Net cashflow
- $-1,020
Break-even live
Sensitivity live
| Price | -10% $-550 | -5% $-785 | +0% $-1,020 | +5% $-1,255 | +10% $-1,490 |
|---|---|---|---|---|---|
| Rent | -10% $-1,388 | -5% $-1,204 | +0% $-1,020 | +5% $-836 | +10% $-652 |
| Rate | -1.0pp $-677 | -0.5pp $-847 | base $-1,020 | +0.5pp $-1,196 | +1.0pp $-1,375 |
UW: 25.0% down · 7.5% · 30yr · 1.5% tax · 5.0% vac · 8.0% maint · 8.0% mgmt
Financing live
Cash to close
- Down payment
- $170,000
- Closing costs
- $20,400
- Reserves months
- —
- Total cash needed
- —
Loan-product check · same deal, 3 products live
Conventional
25% down · 7.5% · 30yr
- Down + closing
- —
- Monthly P&I
- —
- Monthly cashflow
- —
- DSCR
- —
- Eligible?
- —
Personal DTI + credit; lowest rate.
DSCR
20% down · 8.5% · 30yr
- Down + closing
- —
- Monthly P&I
- —
- Monthly cashflow
- —
- DSCR
- —
- Eligible?
- —
No personal income docs; deal must DSCR.
Hard money
10% down · 12.0% · 12mo
- Down + closing
- —
- Monthly P&I
- —
- Monthly cashflow
- —
- DSCR
- —
- Eligible?
- —
Short-term bridge; refi at stabilization.
Rent comps 40 comps
| Address | Beds | Baths | Sqft | Rent | $/sqft | DOM | Units | Dist |
|---|---|---|---|---|---|---|---|---|
| 1927-1929 Grove St Unit 1927-A San Francisco, CA | 1.0 | 1.0 | 885 | $3,995 | $4.51 | 45d | 1 | 0.33mi |
| 412 Broderick St Unit 416 San Francisco, CA | 1.0 | 1.0 | 580 | $4,495 | $7.75 | 7d | 1 | 0.34mi |
| 664 Cole St San Francisco, CA | 2.0 | 1.0 | 1010 | $4,888 | $4.84 | 23d | 1 | 0.38mi |
| 2001 McAllister St San Francisco, CA | 1.0–2.0 | 1.0–2.0 | 815 | $5,500 | $6.74 | 23d | 1 | 0.39mi |
| 826 Central Ave San Francisco, CA | 3.0 | 1.0 | 1100 | $4,989 | $4.54 | 45d | 1 | 0.45mi |
| 1000 Oak St Apt 7 San Francisco, CA | 1.0 | 1.0 | 645 | $3,995 | $6.19 | 45d | 1 | 0.47mi |
| 1715 McAllister St San Francisco, CA | 1.0 | 1.0 | 725 | $3,650 | $5.03 | 45d | 1 | 0.48mi |
| 2095 Fulton St Unit 20952 San Francisco, CA | 1.0 | 1.0 | 550 | $3,550 | $6.45 | 18d | 1 | 0.48mi |
| 1019 Ashbury St San Francisco, CA | 1.0 | 1.0 | 535 | $3,790 | $7.08 | 16d | 1 | 0.49mi |
| 370 Upper Ter Unit 2 San Francisco, CA | 1.0 | 1.0 | 700 | $4,400 | $6.29 | 20d | 1 | 0.57mi |
| 1543 McAllister St #3 San Francisco, CA | 1.0 | 1.0 | 1016 | $4,200 | $4.13 | 0d | 1 | 0.58mi |
| 575 Pierce St San Francisco, CA | 1.0 | 1.0 | 700 | $5,595 | $7.99 | 45d | 1 | 0.58mi |
| 165 States St San Francisco, CA | 2.0 | 2.0 | 1100 | $6,000 | $5.45 | 45d | 1 | 0.60mi |
| 701 Parker Ave Unit 106 San Francisco, CA | 2.0 | 2.0 | 1000 | $4,995 | $5.00 | 0d | 1 | 0.60mi |
| 1050 Stanyan St Unit 1901 San Francisco, CA | 1.0 | 1.0 | 793 | $3,700 | $4.67 | 45d | 1 | 0.64mi |
| 901 Fell St Apt 17 San Francisco, CA | 1.0 | 1.0 | 750 | $3,000 | $4.00 | 0d | 1 | 0.66mi |
| 677 Oak St Unit 8 San Francisco, CA | 2.0 | 1.0 | 850 | $4,395 | $5.17 | 20d | 1 | 0.78mi |
| 1460 Golden Gate Ave Unit 10 San Francisco, CA | 2.0 | 1.0 | 900 | $5,395 | $5.99 | 45d | 1 | 0.78mi |
| 801 Fillmore St Apt 1 San Francisco, CA | 2.0 | 1.0 | 970 | $6,195 | $6.39 | 45d | 1 | 0.79mi |
| 400 Duboce Ave San Francisco, CA | 2.0 | 1.0 | 923 | $7,475 | $8.10 | 25d | 1 | 0.80mi |
| 179 Caselli Ave Unit 2 San Francisco, CA | 3.0 | 1.0 | 950 | $3,750 | $3.95 | 7d | 1 | 0.80mi |
| 1395 Golden Gate Ave San Francisco, CA | 1.0 | 1.0 | 620 | $4,895 | $7.90 | 12d | 1 | 0.82mi |
| 155 Eureka St San Francisco, CA | 1.0 | 1.0 | 750 | $5,000 | $6.67 | 45d | 1 | 0.84mi |
| 155 Eureka St San Francisco, CA | 1.0 | 1.0 | 650 | $4,300 | $6.62 | 26d | 1 | 0.84mi |
| 1350 Golden Gate Ave Unit 13 San Francisco, CA | 1.0 | 1.0 | 595 | $2,500 | $4.20 | 45d | 1 | 0.85mi |
| 730 Anza St Unit 3 San Francisco, CA | 2.0 | 1.0 | 850 | $4,300 | $5.06 | 9d | 1 | 0.86mi |
| 740 Anza St Unit 02 San Francisco, CA | 1.0 | 1.0 | 800 | $2,995 | $3.74 | 26d | 1 | 0.87mi |
| 777 Arguello Blvd Apt 104 San Francisco, CA | 1.0 | 1.0 | 542 | $3,350 | $6.18 | 22d | 1 | 0.88mi |
| 257 Church St San Francisco, CA | 2.0 | 1.0 | 1100 | $5,995 | $5.45 | 45d | 1 | 0.89mi |
| 684 Arguello Blvd #4 San Francisco, CA | 1.0 | 1.0 | 650 | $3,833 | $5.90 | 7d | 1 | 0.90mi |
| 1412 Lyon St Unit A San Francisco, CA | 2.0 | 1.0 | 915 | $6,000 | $6.56 | 9d | 1 | 0.91mi |
| 38 Dolores St San Francisco, CA | 2.0 | 1.0 | 789 | $5,579 | $7.07 | 0d | 1 | 0.94mi |
| 2760 Sutter St Unit 202 San Francisco, CA | 1.0 | 1.0 | 850 | $3,695 | $4.35 | 4d | 1 | 0.95mi |
| 200 Buchanan St San Francisco, CA | 1.0–2.0 | 1.0–2.0 | 1015 | $9,680 | $9.53 | 0d | 10 | 0.95mi |
| 8 Buchanan St #609 San Francisco, CA | 2.0 | 2.0 | 990 | $6,950 | $7.02 | 9d | 1 | 0.96mi |
| 1310 Fillmore St #608 San Francisco, CA | 1.0 | 1.0 | 744 | $3,975 | $5.34 | 46d | 1 | 1.00mi |
| 236-258 Hugo St Unit 244 San Francisco, CA | 2.0 | 1.0 | 912 | $5,595 | $6.13 | 9d | 1 | 1.00mi |
| 1475 Fillmore St San Francisco, CA | 2.0 | 1.0–2.0 | 749 | $7,483 | $9.98 | 0d | 18 | 1.00mi |
| 1415 Eddy St San Francisco, CA | 2.0 | 1.0 | 800 | $4,950 | $6.19 | 26d | 1 | 1.01mi |
| 3550 Market St Unit 206 San Francisco, CA | 2.0 | 2.0 | 1012 | $4,950 | $4.89 | 20d | 1 | 1.02mi |
Listing history 16 events
-
2026-06-21days on market $680,000 Active 27 DOM
-
2026-06-18days on market $680,000 Active 24 DOM
-
2026-06-17days on market $680,000 Active 23 DOM
-
2026-06-16days on market $680,000 Active 22 DOM
-
2026-06-15days on market $680,000 Active 21 DOM
-
2026-06-13days on market $680,000 Active 19 DOM
-
2026-06-13days on market $680,000 Active 18 DOM
-
2026-06-09days on market $680,000 Active 15 DOM
-
2026-06-08days on market $680,000 Active 14 DOM
-
2026-06-07days on market $680,000 Active 13 DOM
-
2026-06-04days on market $680,000 Active 10 DOM
-
2026-06-03days on market $680,000 Active 9 DOM
-
2026-06-02days on market $680,000 Active 8 DOM
-
2026-06-01days on market $680,000 Active 7 DOM
-
2026-05-31days on market $680,000 Active 6 DOM
-
2026-05-25$680,000 Active
ⓘ Source: listings_history table (triggers on properties + properties_extension) + one-shot
backfill from property_details.listing_events for pre-trigger history.
Climate risk First Street
- Flood 1/10 Low FEMA zone X (unshaded) · 0% chance over 30 yrs
- Wildfire 1/10 Low
- Heat 2/10 Low 7 d/yr ≥76°F today · 17 d/yr by 30 yrs out
- Wind 1/10 Low
- Air quality 8/10 Severe 15 unhealthy d/yr today · 15 by 30 yrs out
Nearby sold comps map
Loading sold comps map…
Walkable amenities ~0.75 mi
Loading nearby amenities…
Taxation est. · year 1
- Rental income
- $55,893
- − Mortgage interest
- −$38,091
- − Property taxes
- −$10,200
- − Insurance
- −$3,400
- − Repairs & maintenance
- −$4,471
- − Management
- −$4,471
- − Depreciation
- −$19,782
- Taxable loss
- −$24,522
- Est. tax savings @ 24.0%
- +$5,885
- After-tax cash flow
- $-6,351/yr
For passive investors: Depreciation is non-cash, so a rental often shows a tax loss while cash-flowing — sheltering income. Rental losses are passive: they offset passive income freely, and up to $25,000/yr can offset ordinary (W-2) income if you actively participate and your MAGI is under $100k (phasing out to $0 by $150k); unused losses carry forward. On sale, claimed depreciation is recaptured at up to 25%, and gains may owe capital-gains tax (a 1031 exchange can defer both). Figures are a year-1 estimate at your 24.0% rate — not tax advice; consult a CPA.
Schools (NCES district)
- District
- San Francisco Unified
- NCES district ID
- 0634410
- Math proficiency
- 50% ▬ 0.00%
- Reading proficiency
- 56% ▲ 1.00%
- Median HH income
- $81,249
- Composite
- 50.14/100
- National rank
- #4088
- State rank
- #322 of 1400 in CA
Livability — San Francisco
- Score
- 76/100
- State rank
- #90
- US rank
- #3143
Category grades
Schools grade is shown separately in the Schools card above.
Census & demographics
- Census place
- San Francisco, CA
- County
- San Francisco County · 827,552 people
- City population
- 827,552
- Metro
- San Francisco-Oakland-Berkeley, CA
- Population (ZIP)
- 36,198
- Household income
- $167,066
- Rent vs Own
- Severe rent burden
- 1811.0
Population outlook (San Francisco County) Hauer SSP2
- Today (2025)
- 1,030,936 people
- By 2030
- 1,110,409 · +7.7%
- By 2040
- 1,270,010 · +23.2%
- By 2050
- 1,435,001 · +39.2%
- By 2075
- 1,779,074 · +72.6%
- By 2100
- 1,966,767 · +90.8%
Race, ethnicity, and origin ACS 2023
- Neighborhood character
- Diverse neighborhood (Simpson 0.55)
- Race & ethnicity
- White 65% Asian 14% Two or more races 10% Hispanic / Latino 9% Black 4%
- Hispanic origin (detail)
- Mexican 5%
- Common ancestry
- Italian 5% Lithuanian 5% Romanian 3%
- Foreign-born
- 18% · Canada, China, Vietnam
- Languages at home
- 80% English-only · Spanish 5% Chinese 4% French/Haitian/Cajun 4%
Political lean MEDSL · San Francisco
- 2024 margin
- Solid D (+64.8) · D 80.3% · R 15.5% · Other 4.1%
- 2008→2024 swing
- -5.7pp toward R · 2008: 70.5pp · 2024: 64.8pp
- All cycles
- 2024: D+64.8 2020: D+72.5 2016: D+76.1 2012: D+70.2 2008: D+70.5
Not yet ingested
- Civics
- —
Market trends
- HPI YoY
- ▲ 9.27%
- Current HPI
- 228.7304
- Rent YoY
- ▲ 18.24%
- Metro
- San Francisco-Oakland-Berkeley, CA
- State GDP YoY
- ▲ 3.21%
- F500 in state
- 116
Industry mix (Fortune 500 HQ in CA)
| Industry | F500 HQs | Revenue |
|---|---|---|
| Technology | 27 | $1,492B |
|
||
| Financial Services | 3 | $174B |
|
||
| Retail | 3 | $44B |
|
||
| Insurance | 3 | $26B |
|
||
| Media / Entertainment | 2 | $115B |
|
||
| Pharmaceuticals / Biotech | 2 | $62B |
|
||
Price history
1 event — show timeline
- 2026-05-25 Listed $680,000 San Francisco MLS
Cash-flow waterfall
monthlySold comps — $/sqft
last 12 mo · ≤1 miLoading sold comps…