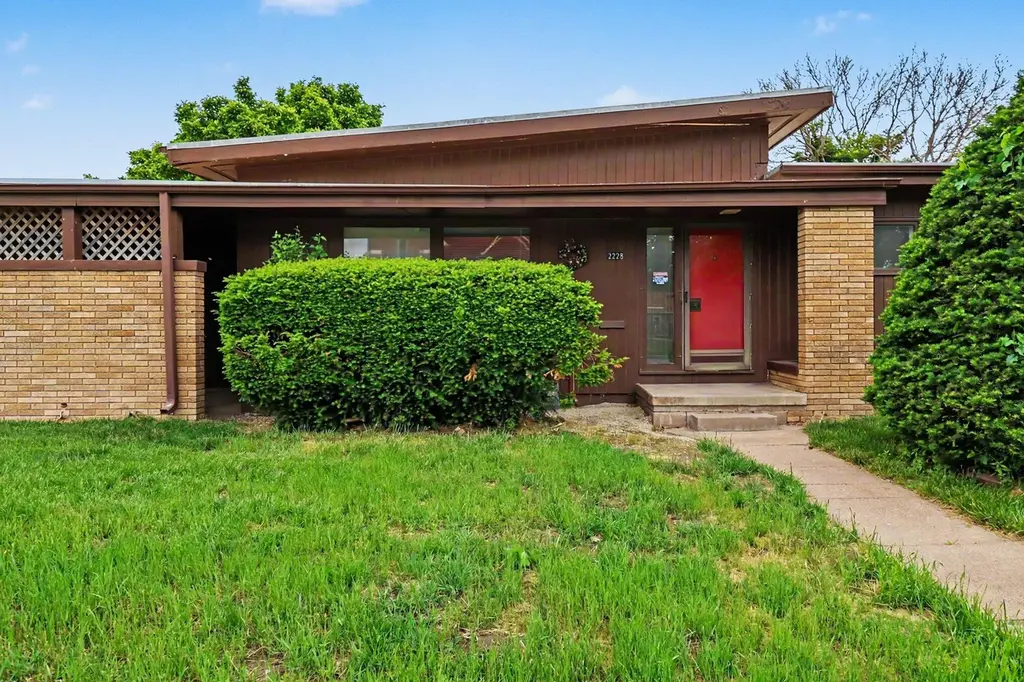
2228 Avenue B
Council Bluffs, IA 51501
$170,000D+
3 bd · 1.0 ba ·
2,420 sqft ·
Built 1954
· SingleFamily
· Pending
· 2 DOM
Cashflow @ list (25.0% down · 7.5%)
Estimated rent
$1,615/mo
Mortgage (P&I)
−$891
Tax + insurance
−$401
HOA
−$0
Vac / Maint / Mgmt
−$339
Net cashflow
$-17/mo
Annual
$-202/yr
Cap rate
6.17%
Cash-on-cash
-0.42%
DSCR
0.98
1% rule
0.95%
Cash to close
$47,600
Investor read
- This is a 3-bed/1.0-bath single-family listed at $170k.
- At list price, monthly cash flow is $-17 ($-202/yr) — negative.
- To cash-flow at today's rent, offer at most $167k (1.7% below list).
- To meet the 1% rule (rent ≥ 1% of price), the offer needs to be $161k (5.0% below list).
- Only 2 days on market — expect competitive offers; lowballing is unlikely to land.
- Recommended offer: $161k (5.0% below list) — sets the bar for 1% rule.
- Local home prices are declining (-3.0%/yr); year-one equity from $1k of loan paydown is wiped out by about $5k of value loss. Plan a longer hold.
- Location reads 70/100 on livability (#368 in IA) — a middle-class / working-renter tenant base. Strengths: cost of living A+, housing A+, health & safety B+; Watch: employment C-, amenities D, crime D-.
- Council Bluffs Community School District (urban): math 52% / reading 55% proficiency, ranked #272 of 289 in IA (top 94%) — acceptable for families but not a draw, mixed tenant base, ~2y average lease.
- Zoned schools: Franklin Elementary School (math 54% / reading 54%, grade C, #488 of 616 statewide, top 80%, 497 students, 64% FRL); Woodrow Wilson Middle School (math 54% / reading 51%, grade C+, #209 of 246 statewide, top 85%, 900 students, 75% FRL); Thomas Jefferson High School (math 40% / reading 53%, grade D-, #321 of 336 statewide, top 96%, 1,243 students, 65% FRL) — zoned schools average 68% FRL vs 51% district-wide (17 pts higher); higher-poverty schools than district average — tighter screening recommended.
- Watch-outs: built in 1954 — expect roof / HVAC / electrical / plumbing capex.
- Market conditions: Rents flat; 140 active listings in the ZIP; 1 comparable units currently listed for rent nearby; 679 units permitted in Pottawattamie County in 2024 (566 in 5+ unit buildings).
- Pottawattamie County population projected to shrink 7% by 2050 — rents likely to lag national; underwrite the cash flow, not the appreciation.
- Cap rate 6.2% vs local median 3.3% in Council Bluffs — top-decile yield for the area; either an underpriced asset or a hidden risk that comps aren't pricing in. Stress-test before assuming the spread holds.
- This rent runs 32% of the median local income ($60k/yr) — at the standard rent-burdened threshold; future hikes will face affordability resistance.
Questions for listing agent
- What do current leases actually rent for vs. the listed asking? Can we see a recent rent roll and the last 12 months of T-12 income?
- Built in 1954 — when were the roof, HVAC, electrical panel, plumbing, and water heater last replaced?
- Is there a deadline driving the sale (1031 exchange, divorce, estate, relocation)? That informs how much negotiation room exists.
- Crime grade is D in this area — have there been break-ins, vandalism, or insurance claims at this property in the last 3 years? What carrier currently insures it and at what premium?
- The area grade is low — what's the realistic commute time and amenity access for the typical tenant pool here? Any planned neighborhood developments (good or bad) we should know about?
- What's the average days-on-market for RENTAL listings here right now (not sales)? A rising rental-DOM trend means longer vacancies and softer asking-rent achievability than the comps imply.
- What's the recent tenant-quality profile in this submarket — average credit score on applications, eviction rate, late-payment / NSF rate, and stable-employment percentage? A property-management company in the area should have these aggregated.
- How much new for-sale + rental construction is in the pipeline within 1–3 miles? Heavy new supply typically softens prices + rents 12–24 months out; constrained supply supports both.
CashFlowRE · CFR-DNBYMY2G7A8G54
· Data 4 days ago
cashflowre.app · 2026-05-29