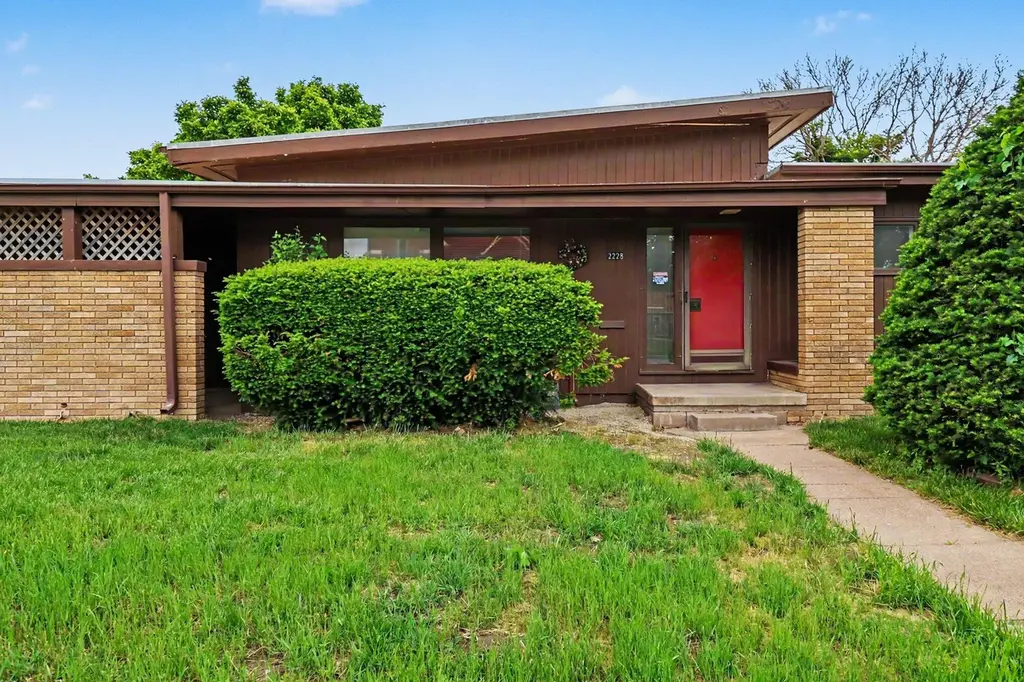
2228 Avenue B · Council Bluffs, IA
Flood risk 1/10 · Minimal
- FEMA flood zone
- X
- Chance of flooding over 30 yrs
- 0.0%
- Est. flood insurance / yr
- $473 – $860
Fire risk 3/10 · Minor
- Est. fire insurance / yr
- $902 – $1,676
Heat risk 4/10 · Minor
- Hot days now (above 104°F)
- 7 days/yr
- Hot days in 30 yrs
- 15 days/yr
Wind risk 2/10 · Minimal
- Chance of severe wind over 30 yrs
- —
Air-quality risk 2/10 · Minimal
- Unhealthy air days now
- 1 days/yr
- Unhealthy air days in 30 yrs
- 1 days/yr
Risk factors via First Street. Map © Google.
Why this score? — see what drove the D+ grade
The composite is a weighted blend of 9 inputs, each scored 0–100. Each bar is that input's sub-score; the figure is the points it added to the 100-point composite (weight × sub-score).
- ARV discount +15.0/15.0
- Cash flow +12.8/30.0
- 1% rule +4.5/10.0
- Schools +4.5/10.0
- DSCR +3.8/10.0
- Livability +3.5/5.0
- Rent growth +2.6/5.0
- Condition / age +2.5/5.0
- Appreciation +0.0/10.0
$170,000
🖨 Deal sheet (PDF) 📄 Offer letter ✓ Due diligence
Listing remarks
An incredible opportunity to restore and reimagine a stunning 1954 mid-century modern home. Perfectly positioned on a . 24-acre corner lot, this property showcases its architectural character with a striking front elevation that highlights the timeless design of the era. This is truly an investor's dream--ready to be brought back to life with your vision, blending modern updates with classic mid-century style. Offering 3 bedrooms and 2 bathrooms, the home provides a solid foundation for a thoughtful renovation. Additional features include a detached 2-car garage and a convenient attached carport, adding both function and flexibility. With its unique design, prime corner setting, and endless
Key facts
- Attached carport
- Corner lot
- Detached garage
Tags
Property features AI
Exterior
- Parking: 2-car garage
- Utilities: Natural gas available; Electricity available; Public sewer
- Home design: Single-family residence; One story
- Construction: Frame construction; Composition roof; Full, partially finished basement; Built on a foundation
- Exterior features: Patio; Lot features: Other
Interior
- Kitchen: Eat-in kitchen
- Heating & cooling: Natural gas heating; Central air conditioning
- Interior features: Eat-in kitchen; Fireplace; Other interior features
- Laundry & utility: Laundry in basement
Neighborhood map
What this means for you Summary
Snapshot
- This is a 3-bed/1.0-bath single-family listed at $170k.
Deal economics
- At list price, monthly cash flow is $-17 ($-202/yr) — negative.
- To cash-flow at today's rent, offer at most $167k (1.7% below list).
- To meet the 1% rule (rent ≥ 1% of price), the offer needs to be $161k (5.0% below list).
- Recommended offer: $161k (5.0% below list) — sets the bar for 1% rule.
- Cap rate 6.2% vs local median 3.3% in Council Bluffs — top-decile yield for the area; either an underpriced asset or a hidden risk that comps aren't pricing in. Stress-test before assuming the spread holds.
Location & tenants
- Location reads 70/100 on livability (#368 in IA) — a middle-class / working-renter tenant base. Strengths: cost of living A+, housing A+, health & safety B+; Watch: employment C-, amenities D, crime D-.
- Council Bluffs Community School District (urban): math 52% / reading 55% proficiency, ranked #272 of 289 in IA (top 94%) — acceptable for families but not a draw, mixed tenant base, ~2y average lease.
- Zoned schools: Franklin Elementary School (math 54% / reading 54%, grade C, #488 of 616 statewide, top 80%, 497 students, 64% FRL); Woodrow Wilson Middle School (math 54% / reading 51%, grade C+, #209 of 246 statewide, top 85%, 900 students, 75% FRL); Thomas Jefferson High School (math 40% / reading 53%, grade D-, #321 of 336 statewide, top 96%, 1,243 students, 65% FRL) — zoned schools average 68% FRL vs 51% district-wide (17 pts higher); higher-poverty schools than district average — tighter screening recommended.
- Market conditions: Rents flat; 140 active listings in the ZIP; 1 comparable units currently listed for rent nearby; 679 units permitted in Pottawattamie County in 2024 (566 in 5+ unit buildings).
- This rent runs 32% of the median local income ($60k/yr) — at the standard rent-burdened threshold; future hikes will face affordability resistance.
Forward outlook
- Local home prices are declining (-3.0%/yr); year-one equity from $1k of loan paydown is wiped out by about $5k of value loss. Plan a longer hold.
- Pottawattamie County population projected to shrink 7% by 2050 — rents likely to lag national; underwrite the cash flow, not the appreciation.
Negotiation context
- Only 2 days on market — expect competitive offers; lowballing is unlikely to land.
Risks & watch-outs
- Watch-outs: built in 1954 — expect roof / HVAC / electrical / plumbing capex.
Questions for the listing agent
- What do current leases actually rent for vs. the listed asking? Can we see a recent rent roll and the last 12 months of T-12 income?
- Built in 1954 — when were the roof, HVAC, electrical panel, plumbing, and water heater last replaced?
- Is there a deadline driving the sale (1031 exchange, divorce, estate, relocation)? That informs how much negotiation room exists.
- Crime grade is D in this area — have there been break-ins, vandalism, or insurance claims at this property in the last 3 years? What carrier currently insures it and at what premium?
- The area grade is low — what's the realistic commute time and amenity access for the typical tenant pool here? Any planned neighborhood developments (good or bad) we should know about?
- What's the average days-on-market for RENTAL listings here right now (not sales)? A rising rental-DOM trend means longer vacancies and softer asking-rent achievability than the comps imply.
- What's the recent tenant-quality profile in this submarket — average credit score on applications, eviction rate, late-payment / NSF rate, and stable-employment percentage? A property-management company in the area should have these aggregated.
- How much new for-sale + rental construction is in the pipeline within 1–3 miles? Heavy new supply typically softens prices + rents 12–24 months out; constrained supply supports both.
Investment metrics
- 1% rule
- 0.95% ✗
- Cap rate
- 6.17%
- Cash-on-cash
- -0.42%
- DSCR
- 0.98
- GRM
- 8.8
CMA / ARV
- ARV (on-the-fly)
- $295,240
- Comps found
- 12
Show comp detail 12 sales within ~0.75 mi
| Address | Dist | Beds/Ba | Sqft | Sold | Price | $/sf | Match |
|---|---|---|---|---|---|---|---|
| 2031 Avenue B | 0.16mi | 2/1.0 (-1) | 2,305 (-5%) | 15mo | $212,500 | $92 | 67 |
| 125 S 23rd St | 0.27mi | 3/3.0 | 2,287 (-6%) | 8mo | $282,000 | $123 | 63 |
| 2122 Ave G | 0.32mi | 3/2.0 | 2,160 (-11%) | 4mo | $263,000 | $122 | 60 |
| 2615 Avenue D | 0.37mi | 3/2.5 | 2,141 (-12%) | 1mo | $230,000 | $107 | 56 |
| 918 N 24th St | 0.46mi | 4/3.0 (+1) | 2,208 (-9%) | 0mo | $300,000 | $136 | 51 |
| 2024 Avenue A Ave | 0.19mi | 4/2.0 (+1) | 2,062 (-15%) | 13mo | $227,000 | $110 | 47 |
| 2934 Ave B | 0.74mi | 3/1.0 | 2,408 (-0%) | 23mo | $120,000 | $50 | 46 |
| 2025 Avenue B | 0.18mi | 4/3.0 (+1) | 2,140 (-12%) | 17mo | $95,000 | $44 | 45 |
| 2644 Ave I | 0.62mi | 3/4.0 | 2,195 (-9%) | 9mo | $305,000 | $139 | 36 |
| 2450 Avenue I | 0.46mi | 3/2.0 | 2,078 (-14%) | 23mo | $250,000 | $120 | 32 |
| 2340 Avenue M Way | 0.72mi | 4/3.0 (+1) | 2,128 (-12%) | 16mo | $310,000 | $146 | 20 |
| 2336 Ave M Way | 0.73mi | 4/3.0 (+1) | 2,184 (-10%) | 23mo | $285,000 | $130 | 18 |
Match score weights: distance 35% · size 25% · config 20% · recency 20%. Top-matched comps best support the ARV.
Projected returns pro-forma
-3.0% appreciation · 0.56% rent growth · sell at horizon
- IRR
- -20.0%
- Equity multiple
- 0.32×
- Total profit
- $-32,393
- Equity at exit
- $25,348
- IRR
- -20.0%
- Equity multiple
- 0.07×
- Total profit
- $-44,317
- Equity at exit
- $14,698
Cash invested: $47,600 (down + closing). Projections, not guarantees.
Landlord ↔ Tenant lean methodology
- Overall (STATE)
- 83 Strongly Landlord-Friendly
- State Iowa
- 83 Strongly Landlord-Friendly · R+6
- County
- — inherits STATE
- City
- — inherits STATE
ZIP-level market 51501
- Rents YoY
- 0.6%
- Active inventory
- 140
- Price-to-rent
- 8.8×
Monthly cashflow live
- Estimated rent
- $1,615 medium interval (Pro) →
- Mortgage (P&I)
- −$891
- Tax from tax record
- −$330 /mo · $3,960/yr
- Insurance
- −$71
- HOA
- −$0
- Vacancy / Maint / Mgmt
- −$339
- Net cashflow
- $-17
Break-even live
Sensitivity live
| Price | -10% $79 | -5% $31 | +0% $-17 | +5% $-65 | +10% $-113 |
|---|---|---|---|---|---|
| Rent | -10% $-144 | -5% $-81 | +0% $-17 | +5% $47 | +10% $111 |
| Rate | -1.0pp $69 | -0.5pp $26 | base $-17 | +0.5pp $-61 | +1.0pp $-106 |
UW: 25.0% down · 7.5% · 30yr · 1.5% tax · 5.0% vac · 8.0% maint · 8.0% mgmt
Financing live
Cash to close
- Down payment
- $42,500
- Closing costs
- $5,100
- Reserves months
- —
- Total cash needed
- —
Loan-product check · same deal, 3 products live
Conventional
25% down · 7.5% · 30yr
- Down + closing
- —
- Monthly P&I
- —
- Monthly cashflow
- —
- DSCR
- —
- Eligible?
- —
Personal DTI + credit; lowest rate.
DSCR
20% down · 8.5% · 30yr
- Down + closing
- —
- Monthly P&I
- —
- Monthly cashflow
- —
- DSCR
- —
- Eligible?
- —
No personal income docs; deal must DSCR.
Hard money
10% down · 12.0% · 12mo
- Down + closing
- —
- Monthly P&I
- —
- Monthly cashflow
- —
- DSCR
- —
- Eligible?
- —
Short-term bridge; refi at stabilization.
Rent comps 1 comps
| Address | Beds | Baths | Sqft | Rent | $/sqft | DOM | Units | Dist |
|---|---|---|---|---|---|---|---|---|
| 829 8th Ave Council Bluffs, IA | 3.0 | 2.0 | 1690 | $1,800 | $1.07 | 5d | 1 | 1.27mi |
Listing history 1 events
-
2026-05-20$170,000 Active
ⓘ Source: listings_history table (triggers on properties + properties_extension) + one-shot
backfill from property_details.listing_events for pre-trigger history.
Tax reassessment forecast IA · Partial reset (capped growth)
- Current annual tax
- $3,960 · $330/mo
- Projected year-2 tax
- $3,960 · $330/mo
- Expected delta
- $0/yr ($0/mo · 0.0%)
ⓘ Screening estimate from a state-policy table — verify with the county assessor before closing.
Climate risk First Street
- Flood 1/10 Low FEMA zone X · 0% chance over 30 yrs
- Wildfire 3/10 Moderate
- Heat 4/10 Moderate 7 d/yr ≥104°F today · 15 d/yr by 30 yrs out
- Wind 2/10 Low
- Air quality 2/10 Low 1 unhealthy d/yr today · 1 by 30 yrs out
Nearby sold comps map
Loading sold comps map…
Walkable amenities ~0.75 mi
Loading nearby amenities…
Taxation est. · year 1
- Rental income
- $19,375
- − Mortgage interest
- −$9,523
- − Property taxes
- −$3,960
- − Insurance
- −$850
- − Repairs & maintenance
- −$1,550
- − Management
- −$1,550
- − Depreciation
- −$4,945
- Taxable loss
- −$3,003
- Est. tax savings @ 24.0%
- +$721
- After-tax cash flow
- $519/yr
For passive investors: Depreciation is non-cash, so a rental often shows a tax loss while cash-flowing — sheltering income. Rental losses are passive: they offset passive income freely, and up to $25,000/yr can offset ordinary (W-2) income if you actively participate and your MAGI is under $100k (phasing out to $0 by $150k); unused losses carry forward. On sale, claimed depreciation is recaptured at up to 25%, and gains may owe capital-gains tax (a 1031 exchange can defer both). Figures are a year-1 estimate at your 24.0% rate — not tax advice; consult a CPA.
Schools (NCES district)
- District
- Council Bluffs Community School District
- NCES district ID
- 1908220
- Math proficiency
- 52% ▼ -9.00%
- Reading proficiency
- 55% ▼ -1.00%
- Median HH income
- $45,259
- Composite
- 45.23/100
- National rank
- #2665
- State rank
- #272 of 289 in IA
Livability — Council Bluffs
- Score
- 70/100
- State rank
- #368
- US rank
- #7695
Category grades
Schools grade is shown separately in the Schools card above.
Census & demographics
- Census place
- Council Bluffs, IA
- County
- Pottawattamie County · 72,590 people
- City population
- 72,590
- Metro
- Omaha-Council Bluffs, NE-IA
- Population (ZIP)
- 34,618
- Household income
- $59,843
- Rent vs Own
- Severe rent burden
- 1110.0
Population outlook (Pottawattamie County) Hauer SSP2
- Today (2025)
- 93,683 people
- By 2030
- 92,772 · -1.0%
- By 2040
- 89,917 · -4.0%
- By 2050
- 86,994 · -7.1%
- By 2075
- 82,756 · -11.7%
- By 2100
- 79,097 · -15.6%
Race, ethnicity, and origin ACS 2023
- Neighborhood character
- Predominantly White (79%)
- Race & ethnicity
- White 79% Hispanic / Latino 14% Two or more races 8% Asian 2% Black 2%
- Hispanic origin (detail)
- Mexican 13%
- Common ancestry
- Portuguese 2% Romanian 2% Iranian 1%
- Foreign-born
- 6% · Canada, China
- Languages at home
- 90% English-only · Spanish 8% Chinese 1%
Political lean MEDSL · Pottawattamie
- 2024 margin
- R (+20.0) · D 39.3% · R 59.3% · Other 1.4%
- 2008→2024 swing
- -18.1pp toward R · 2008: -1.9pp · 2024: -20.0pp
- All cycles
- 2024: R+20.0 2020: R+16.8 2016: R+21.6 2012: R+5.8 2008: R+1.9
Not yet ingested
- Civics
- —
Market trends
- HPI YoY
- ▼ -187.49%
- Current HPI
- 215.2532
- Rent YoY
- ▲ 0.56%
- Metro
- Omaha-Council Bluffs, NE-IA
- State GDP YoY
- ▲ 2.48%
- F500 in state
- 4
Industry mix (Fortune 500 HQ in IA)
| Industry | F500 HQs | Revenue |
|---|---|---|
| Financial Services | 1 | $16B |
|
||
| Retail / Convenience | 1 | $15B |
|
||
Price history
+28.8% since first listed4 events — show timeline
- 2026-06-10 Sold (Public Records) $170,000 Public Records
- 2026-05-23 Pending — SWIAR
- 2026-05-20 Listed $170,000 SWIAR
- 2026-05-13 Sold (Public Records) $132,000 Public Records
Property tax history
+0.1%/yrLatest (2025): $3,960 · -2.1% YoY. Source: county tax records.
Cash-flow waterfall
monthlySold comps — $/sqft
last 12 mo · ≤1 miLoading sold comps…