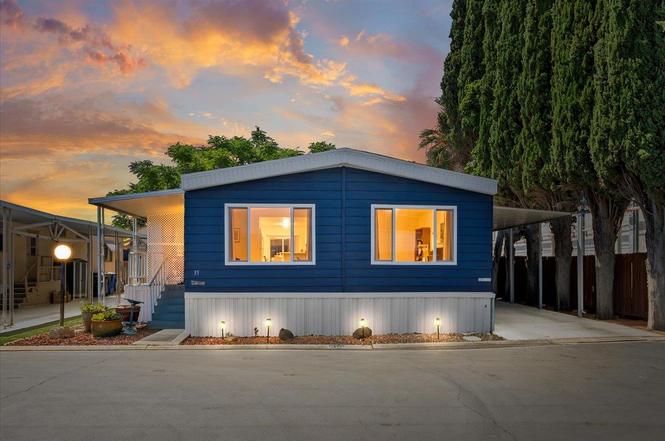
250 E Las Palmas Ave #35
Patterson, CA 95363
$159,000B-
2 bd · 2.0 ba ·
1,344 sqft ·
Built 1979
· Manufactured
· Active
· 3 DOM
Cashflow @ list (25.0% down · 7.5%)
Estimated rent
$2,434/mo
Mortgage (P&I)
−$834
Tax + insurance
−$265
HOA
−$0
Vac / Maint / Mgmt
−$511
Net cashflow
$824/mo
Annual
$9,891/yr
Cap rate
12.51%
Cash-on-cash
22.22%
DSCR
1.99
1% rule
1.53%
Cash to close
$44,520
Investor read
- This is a 2-bed/2.0-bath manufactured listed at $159k.
- At list price, monthly cash flow is $824 ($10k/yr) — positive.
- The deal already cash-flows at list — no discount required.
- Meets the 1% rule at list price ($2k rent vs $159k).
- Only 3 days on market — expect competitive offers; lowballing is unlikely to land.
- Local home prices are declining (-3.0%/yr); year-one equity from $1k of loan paydown is wiped out by about $5k of value loss. Plan a longer hold.
- Location reads 60/100 on livability (#601 in CA) — a middle-class / working-renter tenant base. Strengths: housing A+, crime B; Watch: health & safety D+, amenities F, commute F.
- Patterson Joint Unified (town): math 19% / reading 61% proficiency, ranked #236 of 517 in CA (top 46%) — families likely to look elsewhere, expect single-tenant / working-renter base with shorter leases; 60% free/reduced lunch — lower-income household profile, screen leases tightly.
- Zoned schools: Las Palmas Elementary (669 students, 80% FRL); Creekside Middle (920 students, 79% FRL); Patterson High (math 22% / reading 68%, grade D-, #425 of 1,170 statewide, top 37%, 1,888 students, 67% FRL) — zoned schools average 75% FRL vs 60% district-wide (15 pts higher); higher-poverty schools than district average — tighter screening recommended.
- Market conditions: 160 active listings in the ZIP; 2 comparable units currently listed for rent nearby; solid renter incomes; 923 units permitted in Stanislaus County in 2024 (63 in 5+ unit buildings).
- Stanislaus County population projected at +14% by 2050 — modest demand growth; plan on rents tracking national, not racing it.
- At projected returns (-3.0% appreciation + 3.0% rent growth), your $45k cash investment doubles in ~6 years — after that, you're playing with house money.
- Climate carrying-cost: moderate flood risk; moderate wildfire risk; extreme-heat days projected 7→15/yr by 2055 (HVAC capex compounding) — expect insurance premiums to compound above CPI over the hold.
- Cap rate 12.5% vs local median 3.5% in Patterson — top-decile yield for the area; either an underpriced asset or a hidden risk that comps aren't pricing in. Stress-test before assuming the spread holds.
- This rent runs 31% of the median local income ($96k/yr) — at the standard rent-burdened threshold; future hikes will face affordability resistance.
Questions for listing agent
- Built in 1979 — when were the roof, HVAC, electrical panel, plumbing, and water heater last replaced?
- Is there a deadline driving the sale (1031 exchange, divorce, estate, relocation)? That informs how much negotiation room exists.
- Schools are D-rated, which usually means shorter tenancies and higher turnover. Who's the typical renter profile here, and what's been the actual vacancy rate?
- What's the average days-on-market for RENTAL listings here right now (not sales)? A rising rental-DOM trend means longer vacancies and softer asking-rent achievability than the comps imply.
- What's the recent tenant-quality profile in this submarket — average credit score on applications, eviction rate, late-payment / NSF rate, and stable-employment percentage? A property-management company in the area should have these aggregated.
- How much new for-sale + rental construction is in the pipeline within 1–3 miles? Heavy new supply typically softens prices + rents 12–24 months out; constrained supply supports both.
CashFlowRE · CFR-DPA7AQ260XBDNX
· Data 1 day ago
cashflowre.app · 2026-05-29