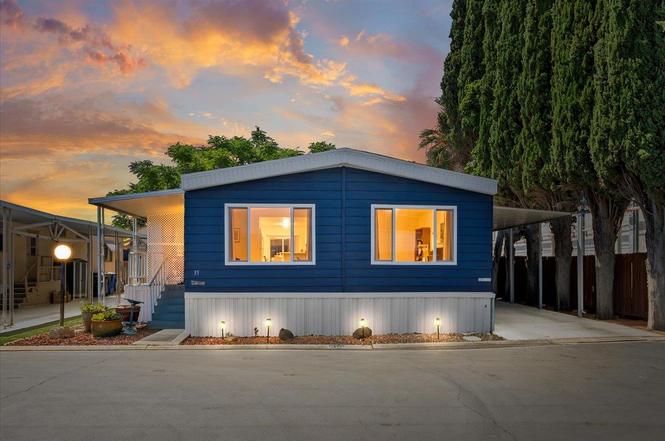
250 E Las Palmas Ave #35 · Patterson, CA
Flood risk 5/10 · Moderate
- FEMA flood zone
- X (unshaded)
- Chance of flooding over 30 yrs
- 0.53%
- Est. flood insurance / yr
- $507 – $1,088
Fire risk 5/10 · Moderate
- Est. fire insurance / yr
- $659 – $1,223
Heat risk 6/10 · Moderate
- Hot days now (above 104°F)
- 7 days/yr
- Hot days in 30 yrs
- 15 days/yr
Wind risk 1/10 · Minimal
- Chance of severe wind over 30 yrs
- —
Air-quality risk 10/10 · Severe
- Unhealthy air days now
- 21 days/yr
- Unhealthy air days in 30 yrs
- 23 days/yr
Risk factors via First Street. Map © Google.
Why this score? — see what drove the B- grade
The composite is a weighted blend of 9 inputs, each scored 0–100. Each bar is that input's sub-score; the figure is the points it added to the 100-point composite (weight × sub-score).
- Cash flow +30.0/30.0
- 1% rule +10.0/10.0
- DSCR +10.0/10.0
- ARV discount +7.5/15.0
- Schools +3.5/10.0
- Livability +3.0/5.0
- Rent growth +2.5/5.0
- Condition / age +2.5/5.0
- Appreciation +0.0/10.0
$159,000
🖨 Deal sheet (PDF) 📄 Offer letter ✓ Due diligence
Listing remarks
Discover a delightful opportunity at 250 E Las Palmas Ave #35 in Patterson, CA. This beautifully remodeled mobile home offers the perfect blend of modern style, comfort, and convenience. Completely renovated from top to bottom, it features a brand-new kitchen, updated bathrooms, new flooring, fresh interior paint, and new windows throughout. The kitchen is a culinary enthusiast's dream, showcasing sleek new stainless steel appliances, a practical G-shaped layout, and a spacious peninsula that seamlessly connects to the living room, creating an open-concept space ideal for entertaining and everyday living. The bathroom features a refreshing walk-in shower, providing a spa-like retreat within
Key facts
- Brand new kitchen
- New flooring
- Updated bathrooms
Tags
Property features AI
Finance
- Financial info: Land lease amount noted (monthly)
- HOA & community: No homeowners association; Land lease listed separately
Exterior
- Parking: Covered parking; Guest parking available
- Utilities: Public water; Public sewer; 220 volts available in laundry
- Home design: Manufactured in-park, double wide; Updated / remodeled; Built in 1979; Located in a senior community
- Construction: Metal skirting; Bendix Manor make
- Exterior features: Composition roof; Regular-shaped lot
Interior
- Kitchen: Built-in gas oven; Gas cook top; Dishwasher; Garbage disposal
- Bedrooms: 2 bedrooms
- Flooring: Carpet; Laminate
- Bathrooms: 2 full bathrooms with tub and separate shower stall
- Heating & cooling: Central heating; Central cooling
- Interior features: Screened-in patio; Dual-pane windows; Dining and family room combo; Living room with additional features
- Laundry & utility: Laundry inside (220V in laundry area)
Neighborhood map
What this means for you Summary
Snapshot
- This is a 2-bed/2.0-bath manufactured listed at $159k.
Deal economics
- At list price, monthly cash flow is $824 ($10k/yr) — positive.
- The deal already cash-flows at list — no discount required.
- Meets the 1% rule at list price ($2k rent vs $159k).
- Cap rate 12.5% vs local median 3.5% in Patterson — top-decile yield for the area; either an underpriced asset or a hidden risk that comps aren't pricing in. Stress-test before assuming the spread holds.
Location & tenants
- Location reads 60/100 on livability (#601 in CA) — a middle-class / working-renter tenant base. Strengths: housing A+, crime B; Watch: health & safety D+, amenities F, commute F.
- Patterson Joint Unified (town): math 19% / reading 61% proficiency, ranked #236 of 517 in CA (top 46%) — families likely to look elsewhere, expect single-tenant / working-renter base with shorter leases; 60% free/reduced lunch — lower-income household profile, screen leases tightly.
- Zoned schools: Las Palmas Elementary (669 students, 80% FRL); Creekside Middle (920 students, 79% FRL); Patterson High (math 22% / reading 68%, grade D-, #425 of 1,170 statewide, top 37%, 1,888 students, 67% FRL) — zoned schools average 75% FRL vs 60% district-wide (15 pts higher); higher-poverty schools than district average — tighter screening recommended.
- Market conditions: 160 active listings in the ZIP; 2 comparable units currently listed for rent nearby; solid renter incomes; 923 units permitted in Stanislaus County in 2024 (63 in 5+ unit buildings).
- This rent runs 31% of the median local income ($96k/yr) — at the standard rent-burdened threshold; future hikes will face affordability resistance.
Forward outlook
- Local home prices are declining (-3.0%/yr); year-one equity from $1k of loan paydown is wiped out by about $5k of value loss. Plan a longer hold.
- Stanislaus County population projected at +14% by 2050 — modest demand growth; plan on rents tracking national, not racing it.
- At projected returns (-3.0% appreciation + 3.0% rent growth), your $45k cash investment doubles in ~6 years — after that, you're playing with house money.
Negotiation context
- Only 3 days on market — expect competitive offers; lowballing is unlikely to land.
Risks & watch-outs
- Climate carrying-cost: moderate flood risk; moderate wildfire risk; extreme-heat days projected 7→15/yr by 2055 (HVAC capex compounding) — expect insurance premiums to compound above CPI over the hold.
Questions for the listing agent
- Built in 1979 — when were the roof, HVAC, electrical panel, plumbing, and water heater last replaced?
- Is there a deadline driving the sale (1031 exchange, divorce, estate, relocation)? That informs how much negotiation room exists.
- Schools are D-rated, which usually means shorter tenancies and higher turnover. Who's the typical renter profile here, and what's been the actual vacancy rate?
- What's the average days-on-market for RENTAL listings here right now (not sales)? A rising rental-DOM trend means longer vacancies and softer asking-rent achievability than the comps imply.
- What's the recent tenant-quality profile in this submarket — average credit score on applications, eviction rate, late-payment / NSF rate, and stable-employment percentage? A property-management company in the area should have these aggregated.
- How much new for-sale + rental construction is in the pipeline within 1–3 miles? Heavy new supply typically softens prices + rents 12–24 months out; constrained supply supports both.
Investment metrics
- 1% rule
- 1.53% ✓
- Cap rate
- 12.51%
- Cash-on-cash
- 22.22%
- DSCR
- 1.99
- GRM
- 5.4
CMA / ARV
- ARV (on-the-fly)
- $94,080
- Comps found
- 6
Show comp detail 6 sales within ~0.75 mi
| Address | Dist | Beds/Ba | Sqft | Sold | Price | $/sf | Match |
|---|---|---|---|---|---|---|---|
| 250 E Las Palmas Ave #41 | 0.00mi | 2/2.0 | 1,354 (+1%) | 13mo | $60,000 | $44 | 88 |
| 250 E 250 E Las Palmas Ave #81 | 0.00mi | 2/2.0 | 1,440 (+7%) | 5mo | $84,000 | $58 | 84 |
| 250 E Las Palmas Ave #8 | 0.02mi | 2/2.0 | 1,420 (+6%) | 8mo | $115,000 | $81 | 83 |
| 250 E Las Palmas Ave #80 | 0.06mi | 2/2.0 | 1,200 (-11%) | 16mo | $84,000 | $70 | 66 |
| 250 E Las Palmas Ave #77 | 0.06mi | 3/2.0 (+1) | 1,440 (+7%) | 18mo | $91,200 | $63 | 65 |
| 250 E Las Palmas Ave #40 | 0.00mi | 3/2.0 (+1) | 1,188 (-12%) | 19mo | $105,000 | $88 | 60 |
Match score weights: distance 35% · size 25% · config 20% · recency 20%. Top-matched comps best support the ARV.
Projected returns pro-forma
-3.0% appreciation · 3.0% rent growth · sell at horizon
- IRR
- 15.0%
- Equity multiple
- 1.60×
- Total profit
- $26,770
- Equity at exit
- $23,707
- IRR
- 23.7%
- Equity multiple
- 3.05×
- Total profit
- $91,061
- Equity at exit
- $13,747
Cash invested: $44,520 (down + closing). Projections, not guarantees.
Landlord ↔ Tenant lean methodology
- Overall (STATE)
- 18 Strongly Tenant-Friendly
- State California
- 18 Strongly Tenant-Friendly · D+13
- County
- — inherits STATE
- City
- — inherits STATE
ZIP-level market 95363
- Home prices YoY
- -34.8%
- Active inventory
- 160
- Price-to-rent
- 5.4×
Monthly cashflow live
- Estimated rent
- $2,434 medium interval (Pro) →
- Mortgage (P&I)
- −$834
- Tax est. 1.5%
- −$199 /mo · $2,385/yr
- Insurance
- −$66
- HOA
- −$0
- Vacancy / Maint / Mgmt
- −$511
- Net cashflow
- $824
Break-even live
Sensitivity live
| Price | -10% $934 | -5% $879 | +0% $824 | +5% $769 | +10% $714 |
|---|---|---|---|---|---|
| Rent | -10% $632 | -5% $728 | +0% $824 | +5% $920 | +10% $1,017 |
| Rate | -1.0pp $904 | -0.5pp $865 | base $824 | +0.5pp $783 | +1.0pp $741 |
UW: 25.0% down · 7.5% · 30yr · 1.5% tax · 5.0% vac · 8.0% maint · 8.0% mgmt
Financing live
Cash to close
- Down payment
- $39,750
- Closing costs
- $4,770
- Reserves months
- —
- Total cash needed
- —
Loan-product check · same deal, 3 products live
Conventional
25% down · 7.5% · 30yr
- Down + closing
- —
- Monthly P&I
- —
- Monthly cashflow
- —
- DSCR
- —
- Eligible?
- —
Personal DTI + credit; lowest rate.
DSCR
20% down · 8.5% · 30yr
- Down + closing
- —
- Monthly P&I
- —
- Monthly cashflow
- —
- DSCR
- —
- Eligible?
- —
No personal income docs; deal must DSCR.
Hard money
10% down · 12.0% · 12mo
- Down + closing
- —
- Monthly P&I
- —
- Monthly cashflow
- —
- DSCR
- —
- Eligible?
- —
Short-term bridge; refi at stabilization.
Rent comps 2 comps
| Address | Beds | Baths | Sqft | Rent | $/sqft | DOM | Units | Dist |
|---|---|---|---|---|---|---|---|---|
| 804 Eastwood Way Patterson, CA | 2.0–3.0 | 2.0–2.5 | 1409 | $2,550 | $1.81 | 14d | 5 | 1.07mi |
| 140 Ivy Ave Unit 1545973P Patterson, CA | 2.0 | 2.0 | 1140 | $1,935 | $1.70 | 18d | 1 | 1.15mi |
Listing history 3 events
-
2026-06-21days on market $159,000 Active 3 DOM
-
2026-06-18remarks 699-char remark
-
2026-06-18$159,000 Active 1 DOM
ⓘ Source: listings_history table (triggers on properties + properties_extension) + one-shot
backfill from property_details.listing_events for pre-trigger history.
Climate risk First Street
- Flood 5/10 Major FEMA zone X (unshaded) · 53% chance over 30 yrs
- Wildfire 5/10 Major
- Heat 6/10 Major 7 d/yr ≥104°F today · 15 d/yr by 30 yrs out
- Wind 1/10 Low
- Air quality 10/10 Extreme 21 unhealthy d/yr today · 23 by 30 yrs out
Nearby sold comps map
Loading sold comps map…
Walkable amenities ~0.75 mi
Loading nearby amenities…
Taxation est. · year 1
- Rental income
- $29,211
- − Mortgage interest
- −$8,906
- − Property taxes
- −$2,385
- − Insurance
- −$795
- − Repairs & maintenance
- −$2,337
- − Management
- −$2,337
- − Depreciation
- −$4,625
- Taxable income
- $7,826
- Est. tax owed @ 24.0%
- −$1,878
- After-tax cash flow
- $8,013/yr
For passive investors: Depreciation is non-cash, so a rental often shows a tax loss while cash-flowing — sheltering income. Rental losses are passive: they offset passive income freely, and up to $25,000/yr can offset ordinary (W-2) income if you actively participate and your MAGI is under $100k (phasing out to $0 by $150k); unused losses carry forward. On sale, claimed depreciation is recaptured at up to 25%, and gains may owe capital-gains tax (a 1031 exchange can defer both). Figures are a year-1 estimate at your 24.0% rate — not tax advice; consult a CPA.
Schools (NCES district)
- District
- Patterson Joint Unified
- NCES district ID
- 0630030
- Math proficiency
- 19% ▼ -6.00%
- Reading proficiency
- 61% ▲ 23.00%
- Median HH income
- $55,259
- Composite
- 34.82/100
- National rank
- #5098
- State rank
- #236 of 517 in CA
Livability — Patterson
- Score
- 60/100
- State rank
- #601
- US rank
- #19321
Category grades
Schools grade is shown separately in the Schools card above.
Census & demographics
- Census place
- Patterson, CA
- County
- Stanislaus County · 445,786 people
- City population
- 30,769
- Metro
- Modesto, CA
- Population (ZIP)
- 30,769
- Household income
- $95,679
- Rent vs Own
- Severe rent burden
- 576.0
Population outlook (Stanislaus County) Hauer SSP2
- Today (2025)
- 579,493 people
- By 2030
- 598,000 · +3.2%
- By 2040
- 630,930 · +8.9%
- By 2050
- 658,300 · +13.6%
- By 2075
- 712,363 · +22.9%
- By 2100
- 719,805 · +24.2%
Race, ethnicity, and origin ACS 2023
- Neighborhood character
- Majority Hispanic (65%)
- Race & ethnicity
- Hispanic / Latino 65% Two or more races 35% White 19% Asian 5% Black 4% Pacific Islander 2%
- Hispanic origin (detail)
- Mexican 60%
- Common ancestry
- Russian 3% Italian 2% Estonian 1%
- Foreign-born
- 23% · Canada, China, Vietnam
- Languages at home
- 44% English-only · Spanish 49% Other Indo-European 2% Tagalog/Filipino 2%
Political lean MEDSL · Stanislaus
- 2024 margin
- R (+11.0) · D 43.2% · R 54.2% · Other 2.6%
- 2008→2024 swing
- -12.7pp toward R · 2008: 1.7pp · 2024: -11.0pp
- All cycles
- 2024: R+11.0 2020: D+0.8 2016: D+0.6 2012: D+0.7 2008: D+1.7
Not yet ingested
- Civics
- —
Market trends
- HPI YoY
- ▼ -151.23%
- Current HPI
- 283.6929
- Rent YoY
- —
- Metro
- Modesto, CA
- State GDP YoY
- ▲ 3.21%
- F500 in state
- 116
Industry mix (Fortune 500 HQ in CA)
| Industry | F500 HQs | Revenue |
|---|---|---|
| Technology | 27 | $1,492B |
|
||
| Financial Services | 3 | $174B |
|
||
| Retail | 3 | $44B |
|
||
| Insurance | 3 | $26B |
|
||
| Media / Entertainment | 2 | $115B |
|
||
| Pharmaceuticals / Biotech | 2 | $62B |
|
||
Cash-flow waterfall
monthlySold comps — $/sqft
last 12 mo · ≤1 miLoading sold comps…