2208 W Baseline Ave #102
Apache Junction, AZ 85120
$59,000B-
3 bd · 2.0 ba ·
1,568 sqft ·
Built 1996
· Manufactured
· Active
· 77 DOM
Cashflow @ list (25.0% down · 7.5%)
Estimated rent
$2,240/mo
Mortgage (P&I)
−$309
Tax + insurance
−$98
HOA
−$0
Vac / Maint / Mgmt
−$470
Net cashflow
$1,362/mo
Annual
$16,340/yr
Cap rate
33.99%
Cash-on-cash
98.91%
DSCR
5.40
1% rule
3.80%
Cash to close
$16,520
Investor read
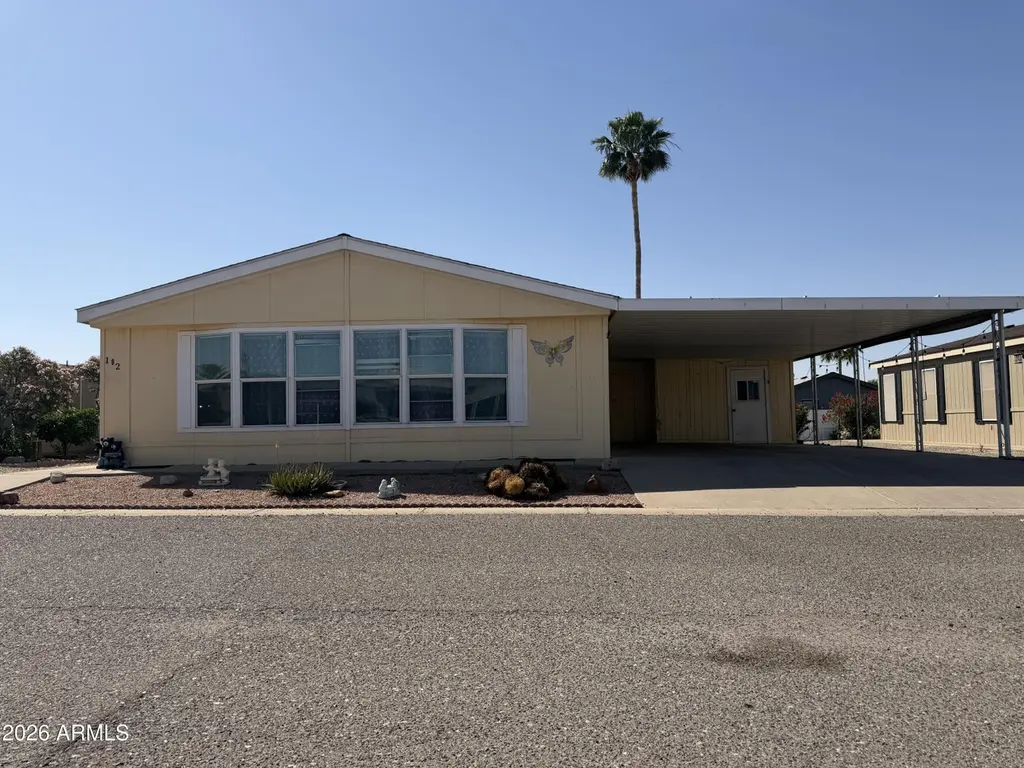
- This is a 3-bed/2.0-bath manufactured listed at $59k. Condition is rated fair.
- At list price, monthly cash flow is $1k ($16k/yr) — positive.
- The deal already cash-flows at list — no discount required.
- Meets the 1% rule at list price ($2k rent vs $59k).
- It's been on market 77 days — a 6% lower offer ($55k) is reasonable based on typical stale-listing flexibility.
- Recommended offer: $55k (6.0% below list) — sets the bar for market timing.
- Local home prices are declining (-3.0%/yr); year-one equity from $408 of loan paydown is wiped out by about $2k of value loss. Plan a longer hold.
- Location reads 66/100 on livability (#70 in AZ) — a middle-class / working-renter tenant base. Strengths: cost of living A+, housing A+; Watch: crime D+, schools F, amenities F.
- Apache Junction Unified District (4443) (suburban): math 15% / reading 20% proficiency, ranked #195 of 249 in AZ (top 78%) — low school quality limits family demand, transient renter base, plan for 1-2y turnover.
- Market conditions: Rents falling (-3.5%/yr); 455 active listings in the ZIP; 10 comparable units currently listed for rent nearby; rentals at typical pace (median 25d on market — plan ~3-4 weeks tenant-placement turnaround); 9,504 units permitted in Pinal County in 2024 (776 in 5+ unit buildings).
- At projected returns (-3.0% appreciation + 0.0% rent growth), your $17k cash investment doubles in ~2 years — after that, you're playing with house money.
- Climate carrying-cost: moderate wildfire risk; extreme-heat days projected 6→14/yr by 2055 (HVAC capex compounding) — expect insurance premiums to compound above CPI over the hold.
- Cap rate 34.0% vs local median 3.5% in Apache Junction — top-decile yield for the area; either an underpriced asset or a hidden risk that comps aren't pricing in. Stress-test before assuming the spread holds.
- At $2,240/mo this rent would consume 47% of the median local household income ($58k/yr) (locally 686% of renters already pay >50% of income on rent) — very limited rent-growth headroom before tenants either downsize or default.
Questions for listing agent
- It's been on market 77 days. Have you received any prior offers? Is the seller open to a 6% concession, seller financing, or rate buy-down credit?
- Have any recent inspections been done? Can we get a copy of the seller's disclosures and any deferred-maintenance estimates?
- Why hasn't it sold? Are there any deal-killer items the seller is aware of (foundation, flood, title, zoning, code violations)?
- Is there a deadline driving the sale (1031 exchange, divorce, estate, relocation)? That informs how much negotiation room exists.
- Schools are F-rated, which usually means shorter tenancies and higher turnover. Who's the typical renter profile here, and what's been the actual vacancy rate?
- Crime grade is D in this area — have there been break-ins, vandalism, or insurance claims at this property in the last 3 years? What carrier currently insures it and at what premium?
- What's the average days-on-market for RENTAL listings here right now (not sales)? A rising rental-DOM trend means longer vacancies and softer asking-rent achievability than the comps imply.
- What's the recent tenant-quality profile in this submarket — average credit score on applications, eviction rate, late-payment / NSF rate, and stable-employment percentage? A property-management company in the area should have these aggregated.
Repairs flagged (vision-AI assessment)
- Moderate: Kitchen cabinets — Dated appearance
- Minor: Bathroom fixtures — New sink fixtures
- Moderate: Exterior siding — Weathered appearance
- Moderate: Interior walls/paint — Faded paint
CashFlowRE · CFR-DSTZNME79WD1Y2
· Data 2 days ago
cashflowre.app · 2026-05-29