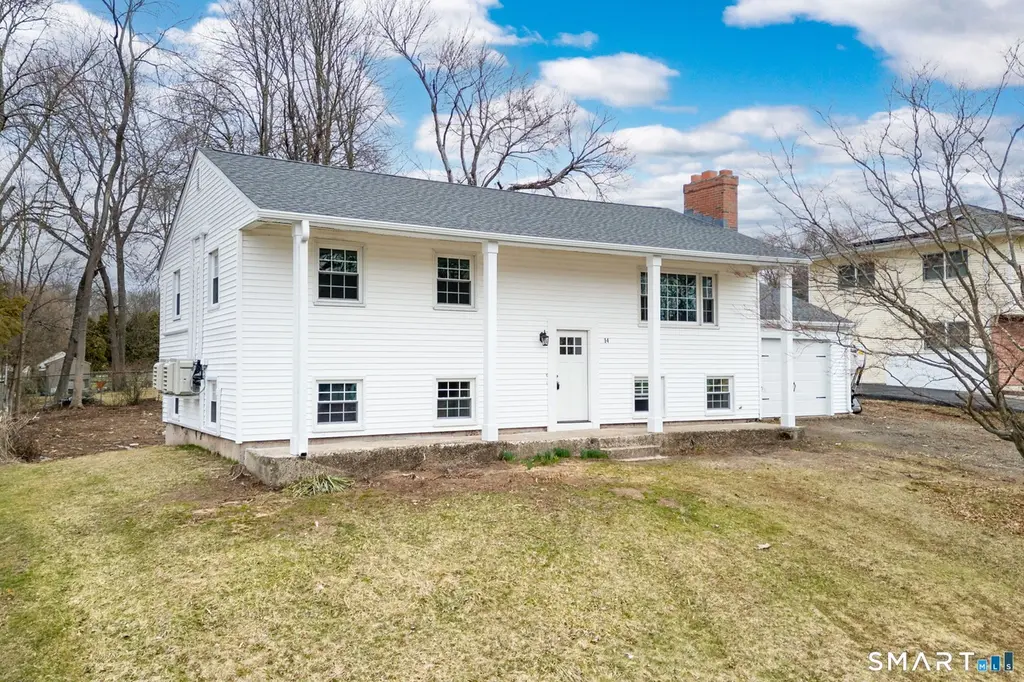
14 Bridgeport Ave
Bristol, CT 06010
$449,000F
3 bd · 2.0 ba ·
1,050 sqft ·
Built 1963
· MultiFamily
· Under Contract
· 12 DOM
Cashflow @ list (25.0% down · 7.5%)
Estimated rent
$3,325/mo
Mortgage (P&I)
−$2,355
Tax + insurance
−$639
HOA
−$0
Vac / Maint / Mgmt
−$698
Net cashflow
$-367/mo
Annual
$-4,399/yr
Cap rate
5.31%
Cash-on-cash
-3.50%
DSCR
0.84
1% rule
0.74%
Cash to close
$125,720
Investor read
- This is a 2 × 2-bed/1.0-bath units multifamily listed at $449k.
- At list price, monthly cash flow is $-367 ($-4k/yr) — negative. Per door: $-183/mo.
- To cash-flow at today's rent, offer at most $384k (14.4% below list).
- To meet the 1% rule (rent ≥ 1% of price), the offer needs to be $332k (25.9% below list).
- Only 12 days on market — expect competitive offers; lowballing is unlikely to land.
- Recommended offer: $332k (25.9% below list) — sets the bar for 1% rule.
- Local home prices are declining (-3.0%/yr); year-one equity from $3k of loan paydown is wiped out by about $13k of value loss. Plan a longer hold.
- Location reads 81/100 on livability (#21 in CT, #1,585 nationally) — a professional / high-income tenant draw. Strengths: crime A+, housing A+, health & safety A+; Watch: schools C-, commute F.
- Bristol School District (suburban): math 28% / reading 44% proficiency, ranked #109 of 153 in CT (top 71%) — families likely to look elsewhere, expect single-tenant / working-renter base with shorter leases.
- Market conditions: Rents rising fast (+5.4%/yr); 220 active listings in the ZIP; 4 comparable units currently listed for rent nearby; rentals leasing fast (median 12d on market — plan ~1-2 weeks tenant-placement turnaround); solid renter incomes; 502 units permitted in Naugatuck Valley Planning Region in 2024 (171 in 5+ unit buildings).
- 2 sale attempts with the ask held roughly flat each time — persistent listings suggest the price (not the market) is what's stuck; bring a comps-based counter.
- Current owner paid $150k; list at $449k implies a 199% gain — meaningful room to come down on a strong offer.
- Cap rate 5.3% vs local median 3.3% in Bristol — top-decile yield for the area; either an underpriced asset or a hidden risk that comps aren't pricing in. Stress-test before assuming the spread holds.
- At $3,325/mo this rent would consume 50% of the median local household income ($79k/yr) (locally 2172% of renters already pay >50% of income on rent) — very limited rent-growth headroom before tenants either downsize or default.
Questions for listing agent
- What do current leases actually rent for vs. the listed asking? Can we see a recent rent roll and the last 12 months of T-12 income?
- Can we see the unit-by-unit rent roll, current vacancy, and any below-market leases? What's the average tenancy length?
- What capital expenditures (roof, boiler, parking lot, exteriors) have been made in the last 5 years, and what's planned in the next 2?
- Built in 1963 — when were the roof, HVAC, electrical panel, plumbing, and water heater last replaced?
- Is there a deadline driving the sale (1031 exchange, divorce, estate, relocation)? That informs how much negotiation room exists.
- The area grade is low — what's the realistic commute time and amenity access for the typical tenant pool here? Any planned neighborhood developments (good or bad) we should know about?
- What's the average days-on-market for RENTAL listings here right now (not sales)? A rising rental-DOM trend means longer vacancies and softer asking-rent achievability than the comps imply.
- What's the recent tenant-quality profile in this submarket — average credit score on applications, eviction rate, late-payment / NSF rate, and stable-employment percentage? A property-management company in the area should have these aggregated.
CashFlowRE · CFR-DXJBK33K19Y5KE
· Data 3 weeks ago
cashflowre.app · 2026-05-29