 Duplex
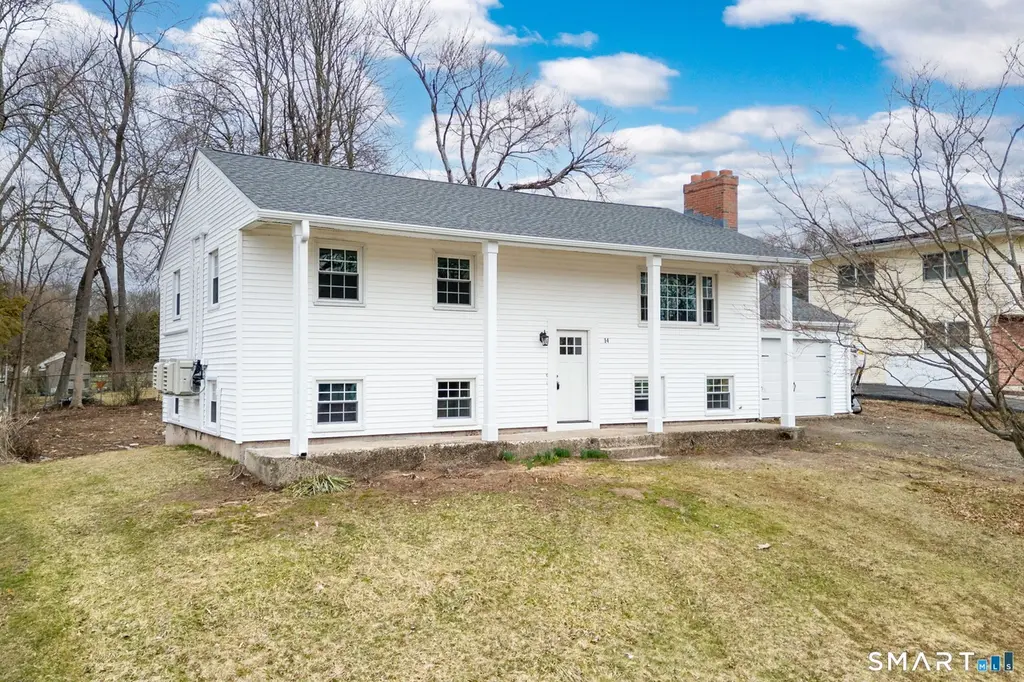
14 Bridgeport Ave · Bristol, CT
Flood risk No data
- FEMA flood zone
- —
- Chance of flooding over 30 yrs
- —
- Est. flood insurance / yr
- —
Fire risk No data
- Est. fire insurance / yr
- —
Heat risk No data
- Hot days now (above threshold)
- —
- Hot days in 30 yrs
- —
Wind risk No data
- Chance of severe wind over 30 yrs
- —
Air-quality risk No data
- Unhealthy air days now
- —
- Unhealthy air days in 30 yrs
- —
Risk factors via First Street. Map © Google.
Why this score? — see what drove the F grade
The composite is a weighted blend of 9 inputs, each scored 0–100. Each bar is that input's sub-score; the figure is the points it added to the 100-point composite (weight × sub-score).
- Cash flow +8.8/30.0
- ARV discount +7.5/15.0
- Livability +4.0/5.0
- Rent growth +3.9/5.0
- Schools +3.2/10.0
- Condition / age +2.5/5.0
- 1% rule +2.4/10.0
- DSCR +2.4/10.0
- Appreciation +0.0/10.0
$449,000
🖨 Deal sheet 📄 Offer letter ✓ Due diligence
Multi-family units
County records classify this as Multi-Family (2-4 Unit). Listing-text estimate: 2 units. confirmed
Listing remarks
A rare opportunity to own this beautifully updated two-family home located in a desirable residential neighborhood. Every detail has been thoughtfully remodeled and upgraded, making this property ideal for both owner-occupants and investors. The upper-level apartment features a warm and inviting living room with a cozy fireplace. The spacious eat-in kitchen offers laminate flooring, brand-new stainless steel appliances, and a large open layout perfect for entertaining. Enjoy additional living space in the 3-season porch. This unit also includes 3 BRs, a fully remodeled bathroom with a walk-in shower, and refinished hardwood floors throughout the main living areas. The lower-level apartment
Key facts
- Remodeled
- Updated
- Living room
Tags
Property features AI
Finance
- Other: Living area reported as 1050 (public record); Property listed as Multi-Family For Sale
- Financial info: No investor-specific income or expense details provided
- HOA & community: No HOA information provided
Exterior
- Parking: Attached garage (1 garage)
- Security: No security features provided
- Utilities: Public water connected; Public sewer connected; Electric service (heat fuel and hot water)
- Home design: Multi-family property (2-family)
- Construction: Frame construction; Concrete foundation
- Exterior features: Level lot; Vinyl siding; Asphalt shingle roof
Interior
- Kitchen: No kitchen appliance details provided
- Bedrooms: 5 bedrooms
- Flooring: No flooring details provided
- Bathrooms: 2 full bathrooms
- Heating & cooling: Split system cooling; Electric baseboard and other heating; Electric hot water
- Interior features: Two fireplaces; Thermopane windows; Common laundry area; No basement
- Laundry & utility: Laundry located in an outside room on the lower level; Common laundry area
Neighborhood map
What this means for you Summary
Snapshot
- This is a 2 × 2-bed/1.0-bath units multifamily listed at $449k.
Deal economics
- At list price, monthly cash flow is $-367 ($-4k/yr) — negative. Per door: $-183/mo.
- To cash-flow at today's rent, offer at most $384k (14.4% below list).
- To meet the 1% rule (rent ≥ 1% of price), the offer needs to be $332k (25.9% below list).
- Recommended offer: $332k (25.9% below list) — sets the bar for 1% rule.
- Cap rate 5.3% vs local median 3.3% in Bristol — top-decile yield for the area; either an underpriced asset or a hidden risk that comps aren't pricing in. Stress-test before assuming the spread holds.
Location & tenants
- Location reads 81/100 on livability (#21 in CT, #1,585 nationally) — a professional / high-income tenant draw. Strengths: crime A+, housing A+, health & safety A+; Watch: schools C-, commute F.
- Bristol School District (suburban): math 28% / reading 44% proficiency, ranked #109 of 153 in CT (top 71%) — families likely to look elsewhere, expect single-tenant / working-renter base with shorter leases.
- Market conditions: Rents rising fast (+5.4%/yr); 220 active listings in the ZIP; 4 comparable units currently listed for rent nearby; rentals leasing fast (median 12d on market — plan ~1-2 weeks tenant-placement turnaround); solid renter incomes; 502 units permitted in Naugatuck Valley Planning Region in 2024 (171 in 5+ unit buildings).
- At $3,325/mo this rent would consume 50% of the median local household income ($79k/yr) (locally 2172% of renters already pay >50% of income on rent) — very limited rent-growth headroom before tenants either downsize or default.
Forward outlook
- Local home prices are declining (-3.0%/yr); year-one equity from $3k of loan paydown is wiped out by about $13k of value loss. Plan a longer hold.
Negotiation context
- Only 12 days on market — expect competitive offers; lowballing is unlikely to land.
- 2 sale attempts with the ask held roughly flat each time — persistent listings suggest the price (not the market) is what's stuck; bring a comps-based counter.
- Current owner paid $150k; list at $449k implies a 199% gain — meaningful room to come down on a strong offer.
Questions for the listing agent
- What do current leases actually rent for vs. the listed asking? Can we see a recent rent roll and the last 12 months of T-12 income?
- Can we see the unit-by-unit rent roll, current vacancy, and any below-market leases? What's the average tenancy length?
- What capital expenditures (roof, boiler, parking lot, exteriors) have been made in the last 5 years, and what's planned in the next 2?
- Built in 1963 — when were the roof, HVAC, electrical panel, plumbing, and water heater last replaced?
- Is there a deadline driving the sale (1031 exchange, divorce, estate, relocation)? That informs how much negotiation room exists.
- The area grade is low — what's the realistic commute time and amenity access for the typical tenant pool here? Any planned neighborhood developments (good or bad) we should know about?
- What's the average days-on-market for RENTAL listings here right now (not sales)? A rising rental-DOM trend means longer vacancies and softer asking-rent achievability than the comps imply.
- What's the recent tenant-quality profile in this submarket — average credit score on applications, eviction rate, late-payment / NSF rate, and stable-employment percentage? A property-management company in the area should have these aggregated.
- How much new apartment / multifamily construction is in the pipeline within 1–3 miles? Heavy new supply (>2% of stock underway) typically softens rents 12–24 months out; light construction supports rent growth.
Investment metrics
- 1% rule
- 0.74% ✗
- Cap rate
- 5.31%
- Cash-on-cash
- -3.50%
- DSCR
- 0.84
- GRM
- 11.3
CMA / ARV
No comps found within radius.
Projected returns pro-forma
-3.0% appreciation · 5.41% rent growth · sell at horizon
- IRR
- -19.6%
- Equity multiple
- 0.30×
- Total profit
- $-87,867
- Equity at exit
- $66,947
- IRR
- -8.2%
- Equity multiple
- 0.43×
- Total profit
- $-71,053
- Equity at exit
- $38,821
Cash invested: $125,720 (down + closing). Projections, not guarantees.
Landlord ↔ Tenant lean methodology
- Overall (STATE)
- 27 Tenant-Leaning
- State Connecticut
- 27 Tenant-Leaning · D+7
- County
- — inherits STATE
- City
- — inherits STATE
ZIP-level market 06010
- Rents YoY
- 5.4%
- Active inventory
- 220
- Price-to-rent
- 22.5×
Monthly cashflow live
- Estimated rent
- $3,325 medium interval (Pro) →
- Mortgage (P&I)
- −$2,355
- Tax from tax record
- −$452 /mo · $5,420/yr
- Insurance
- −$187
- HOA
- −$0
- Vacancy / Maint / Mgmt
- −$698
- Net cashflow
- $-367
Break-even live
2-unit breakdown (identical units grouped — click to expand)
| Units | Beds | Baths | Est. rent |
|---|---|---|---|
| 2× units | 2 | 1 | $3,326 |
| #1 | 2 | 1 | $1,663 |
| #2 | 2 | 1 | $1,663 |
| Total (2 units) | $3,325 | ||
UW: 25.0% down · 7.5% · 30yr · 1.5% tax · 5.0% vac · 8.0% maint · 8.0% mgmt
Financing live
Cash to close
- Down payment
- $112,250
- Closing costs
- $13,470
- Reserves months
- —
- Total cash needed
- —
Loan-product check · same deal, 3 products live
Conventional
25% down · 7.5% · 30yr
- Down + closing
- —
- Monthly P&I
- —
- Monthly cashflow
- —
- DSCR
- —
- Eligible?
- —
Personal DTI + credit; lowest rate.
DSCR
20% down · 8.5% · 30yr
- Down + closing
- —
- Monthly P&I
- —
- Monthly cashflow
- —
- DSCR
- —
- Eligible?
- —
No personal income docs; deal must DSCR.
Hard money
10% down · 12.0% · 12mo
- Down + closing
- —
- Monthly P&I
- —
- Monthly cashflow
- —
- DSCR
- —
- Eligible?
- —
Short-term bridge; refi at stabilization.
Rent comps 4 comps
| Address | Beds | Baths | Sqft | Rent | $/sqft | DOM | Units | Dist |
|---|---|---|---|---|---|---|---|---|
| 73 Shawn Dr Bristol, CT | 3.0 | 1.0 | 1450 | $1,850 | $1.28 | 12d | 1 | 0.56mi |
| 1175 Farmington Ave Bristol, CT | 2.0 | 1.0–1.5 | 875 | $2,039 | $2.33 | 2d | 12 | 0.86mi |
| 43 Hiltbrand Rd Unit 2-9 Bristol, CT | 2.0 | 1.5 | 990 | $1,875 | $1.89 | 3d | 1 | 1.02mi |
| 115 Beths Ave #3 Bristol, CT | 2.0 | 1.5 | 1232 | $1,850 | $1.50 | 24d | 1 | 1.09mi |
Listing history 4 events
-
2026-05-18status Active
-
2026-03-24status Under Contract
-
2026-03-20$449,000 Active
-
2025-10-02soldstatus $150,000
ⓘ Source: listings_history table (triggers on properties + properties_extension) + one-shot
backfill from property_details.listing_events for pre-trigger history.
Tax reassessment forecast CT · Partial reset (capped growth)
- Current annual tax
- $5,420 · $452/mo
- Projected year-2 tax
- $7,514 · $626/mo
- Expected delta
- +$2,094/yr (+$175/mo · 38.6%)
ⓘ Screening estimate from a state-policy table — verify with the county assessor before closing.
Nearby sold comps map
Loading sold comps map…
Walkable amenities ~0.75 mi
Loading nearby amenities…
Taxation est. · year 1
- Rental income
- $39,900
- − Mortgage interest
- −$25,151
- − Property taxes
- −$5,420
- − Insurance
- −$2,245
- − Repairs & maintenance
- −$3,192
- − Management
- −$3,192
- − Depreciation
- −$13,062
- Taxable loss
- −$12,362
- Est. tax savings @ 24.0%
- +$2,967
- After-tax cash flow
- $-1,432/yr
For passive investors: Depreciation is non-cash, so a rental often shows a tax loss while cash-flowing — sheltering income. Rental losses are passive: they offset passive income freely, and up to $25,000/yr can offset ordinary (W-2) income if you actively participate and your MAGI is under $100k (phasing out to $0 by $150k); unused losses carry forward. On sale, claimed depreciation is recaptured at up to 25%, and gains may owe capital-gains tax (a 1031 exchange can defer both). Figures are a year-1 estimate at your 24.0% rate — not tax advice; consult a CPA.
Schools (NCES district)
- District
- Bristol School District
- NCES district ID
- 0900510
- Math proficiency
- 28% ▼ -10.00%
- Reading proficiency
- 44% ▼ -5.00%
- Median HH income
- $59,953
- Composite
- 32.07/100
- National rank
- #5814
- State rank
- #109 of 153 in CT
Livability — Bristol
- Score
- 81/100
- State rank
- #21
- US rank
- #1585
Category grades
Schools grade is shown separately in the Schools card above.
Census & demographics
- Census place
- Bristol, CT
- County
- Hartford County · 754,208 people
- City population
- 61,684
- Metro
- Hartford-East Hartford-Middletown, CT
- Population (ZIP)
- 61,684
- Household income
- $79,314
- Rent vs Own
- Severe rent burden
- 2172.0
Population outlook (Naugatuck Valley County) Hauer SSP2
- By 2040
- 496,846
Race, ethnicity, and origin ACS 2023
- Neighborhood character
- Majority White (65%)
- Race & ethnicity
- White 65% Hispanic / Latino 19% Two or more races 13% Black 7% Asian 5%
- Hispanic origin (detail)
- Mexican 2% Puerto Rican 13%
- Common ancestry
- Lithuanian 11% Romanian 10% Slovak 1%
- Foreign-born
- 10% · Canada
- Languages at home
- 79% English-only · Spanish 11% Other Indo-European 3% Russian/Polish/Slavic 2%
Political lean MEDSL · Naugatuck Valley
- 2024 margin
- Lean R (+7.4) · D 45.6% · R 53.0% · Other 1.4%
- All cycles
- 2024: R+7.4
Not yet ingested
- Civics
- —
Market trends
- HPI YoY
- ▼ -293.55%
- Current HPI
- 255.5419
- Rent YoY
- ▲ 5.41%
- Metro
- Hartford-East Hartford-Middletown, CT
- State GDP YoY
- ▲ 1.06%
- F500 in state
- 38
Industry mix (Fortune 500 HQ in CT)
| Industry | F500 HQs | Revenue |
|---|---|---|
| Industrial Machinery | 4 | $38B |
|
||
| Insurance | 3 | $71B |
|
||
| Financial Services | 2 | $25B |
|
||
| Transportation / Logistics | 2 | $18B |
|
||
| Healthcare | 1 | $247B |
|
||
| Telecommunications | 1 | $55B |
|
||
Price history
+199.3% since first listed4 events — show timeline
- 2026-05-18 Relisted — Smart MLS
- 2026-03-24 Pending — Smart MLS
- 2026-03-20 Listed $449,000 Smart MLS
- 2025-10-02 Sold (Public Records) $150,000 Public Records
Property tax history
+2.1%/yrLatest (2025): $5,420 · +6.0% YoY. Source: county tax records.
Cash-flow waterfall
monthlySold comps — $/sqft
last 12 mo · ≤1 miLoading sold comps…