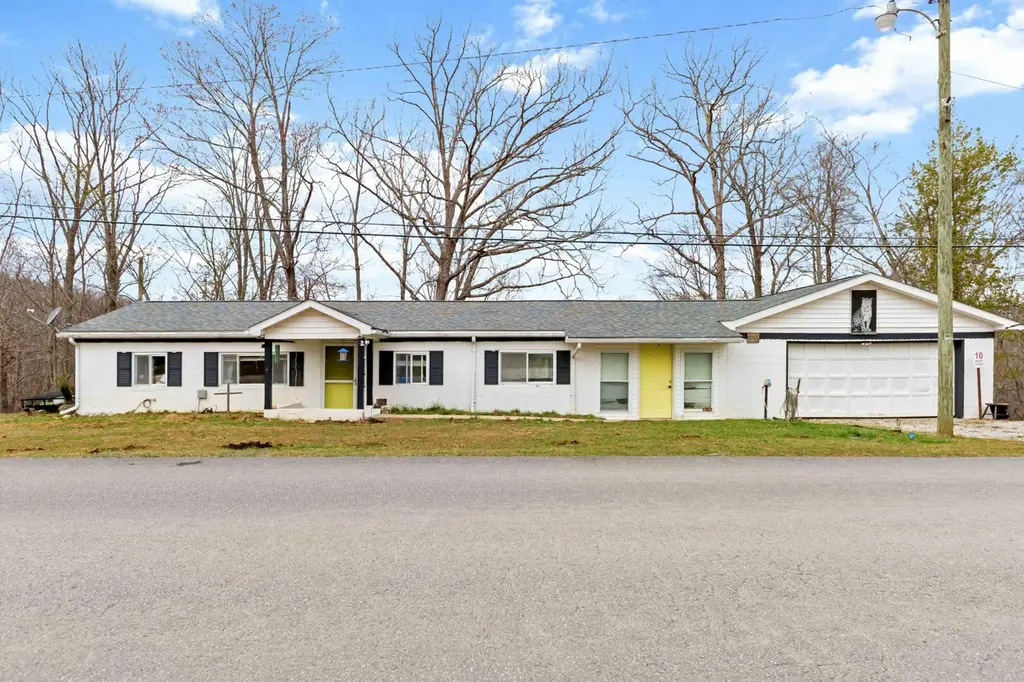
2141 Blue John Rd
Burnside, KY 42519
$139,000B-
3 bd · 1.0 ba ·
1,188 sqft ·
Built 1970
· SingleFamily
· Active
· 101 DOM
Cashflow @ list (25.0% down · 7.5%)
Estimated rent
$1,547/mo
Mortgage (P&I)
−$729
Tax + insurance
−$121
HOA
−$0
Vac / Maint / Mgmt
−$325
Net cashflow
$372/mo
Annual
$4,466/yr
Cap rate
9.51%
Cash-on-cash
11.47%
DSCR
1.51
1% rule
1.11%
Cash to close
$38,920
Investor read
- This is a 3-bed/1.0-bath single-family listed at $139k.
- At list price, monthly cash flow is $372 ($4k/yr) — positive.
- The deal already cash-flows at list — no discount required.
- Meets the 1% rule at list price ($2k rent vs $139k).
- It's been on market 101 days — a 9% lower offer ($126k) is reasonable based on typical stale-listing flexibility.
- Recommended offer: $126k (9.0% below list) — sets the bar for market timing.
- In year one you build about $8k of equity ($961 loan paydown + $7k appreciation (5.2% local appreciation)).
- Location reads 71/100 on livability (#141 in KY) — a middle-class / working-renter tenant base. Strengths: crime A+, cost of living A+, health & safety A+; Watch: schools D+, amenities F, commute F.
- Pulaski County (town): math 43% / reading 53% proficiency, ranked #17 of 165 in KY (top 10%) — families likely to look elsewhere, expect single-tenant / working-renter base with shorter leases.
- Market conditions: 84 active listings in the ZIP; 117 units permitted in Pulaski County in 2024 (50 in 5+ unit buildings).
- 3 sale attempts since 3y ago with the ask held roughly flat each time — persistent listings suggest the price (not the market) is what's stuck; bring a comps-based counter.
- Current owner paid $105k; 32% above their basis — modest negotiation headroom, anchor on the comps not their cost.
- At projected returns (5.2% appreciation + 3.0% rent growth), your $39k cash investment doubles in ~3 years — after that, you're playing with house money.
- By year 5, paydown + projected appreciation supports a ~$36k cash-out refi (75% LTV) — recoverable capital for the next deal without selling this one.
- Climate carrying-cost: major wildfire risk — expect insurance premiums to compound above CPI over the hold.
- Cap rate 9.5% vs local median 3.0% in Burnside — top-decile yield for the area; either an underpriced asset or a hidden risk that comps aren't pricing in. Stress-test before assuming the spread holds.
Questions for listing agent
- It's been on market 101 days. Have you received any prior offers? Is the seller open to a 9% concession, seller financing, or rate buy-down credit?
- Built in 1970 — when were the roof, HVAC, electrical panel, plumbing, and water heater last replaced?
- Why hasn't it sold? Are there any deal-killer items the seller is aware of (foundation, flood, title, zoning, code violations)?
- Is there a deadline driving the sale (1031 exchange, divorce, estate, relocation)? That informs how much negotiation room exists.
- Schools are D-rated, which usually means shorter tenancies and higher turnover. Who's the typical renter profile here, and what's been the actual vacancy rate?
- What's the average days-on-market for RENTAL listings here right now (not sales)? A rising rental-DOM trend means longer vacancies and softer asking-rent achievability than the comps imply.
- What's the recent tenant-quality profile in this submarket — average credit score on applications, eviction rate, late-payment / NSF rate, and stable-employment percentage? A property-management company in the area should have these aggregated.
- How much new for-sale + rental construction is in the pipeline within 1–3 miles? Heavy new supply typically softens prices + rents 12–24 months out; constrained supply supports both.
CashFlowRE · CFR-DYVRTBD7K3KGF7
· Data 2 days ago
cashflowre.app · 2026-05-29