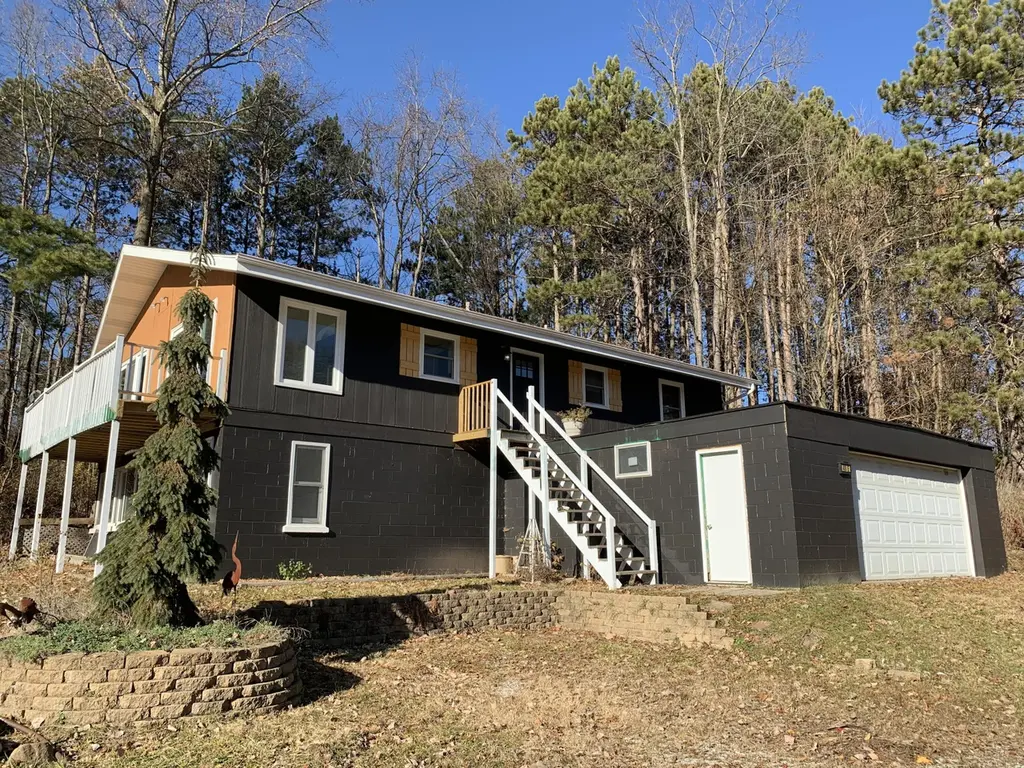
48 E Division Rd
Valparaiso, IN 46383
$244,900D
3 bd · 2.0 ba ·
1,288 sqft ·
Built 1982
· SingleFamily
· Active
· 271 DOM
Cashflow @ list (25.0% down · 7.5%)
Estimated rent
$1,627/mo
Mortgage (P&I)
−$1,284
Tax + insurance
−$212
HOA
−$0
Vac / Maint / Mgmt
−$342
Net cashflow
$-211/mo
Annual
$-2,528/yr
Cap rate
5.26%
Cash-on-cash
-3.69%
DSCR
0.84
1% rule
0.66%
Cash to close
$68,572
Investor read
- This is a 3-bed/2.0-bath single-family listed at $245k.
- At list price, monthly cash flow is $-211 ($-3k/yr) — negative.
- To cash-flow at today's rent, offer at most $208k (15.2% below list).
- To meet the 1% rule (rent ≥ 1% of price), the offer needs to be $163k (33.6% below list).
- It's been on market 271 days — a 12% lower offer ($216k) is reasonable based on typical stale-listing flexibility.
- Recommended offer: $163k (33.6% below list) — sets the bar for 1% rule.
- Local home prices are declining (-3.0%/yr); year-one equity from $2k of loan paydown is wiped out by about $7k of value loss. Plan a longer hold.
- Location reads 82/100 on livability (#12 in IN, #1,149 nationally) — a professional / high-income tenant draw. Strengths: crime A+, cost of living A+, housing A+; Watch: amenities D-, commute F.
- East Porter County School Corporation (rural): math 58% / reading 63% proficiency, ranked #13 of 301 in IN (top 4%) — acceptable for families but not a draw, mixed tenant base, ~2y average lease; only 14% free/reduced lunch — higher-income household profile.
- Zoned schools: Morgan Township Elementary School (math 67% / reading 62%, grade B, #78 of 994 statewide, top 9%, 359 students, 12% FRL) — zoned schools at 12% FRL track the district average.
- Market conditions: Rents rising (+3.5%/yr); 260 active listings in the ZIP; solid renter incomes; 542 units permitted in Porter County in 2024 (0 in 5+ unit buildings).
- Porter County population projected at +6% by 2050 — modest demand growth; plan on rents tracking national, not racing it.
- 2 sale attempts; this cycle's ask has dropped $25k (9%) from the opening price — seller is motivated, your offer sets the floor, not the list.
- Climate carrying-cost: major wildfire risk — expect insurance premiums to compound above CPI over the hold.
- Cap rate 5.3% vs local median 2.9% in Valparaiso — top-decile yield for the area; either an underpriced asset or a hidden risk that comps aren't pricing in. Stress-test before assuming the spread holds.
Questions for listing agent
- What do current leases actually rent for vs. the listed asking? Can we see a recent rent roll and the last 12 months of T-12 income?
- It's been on market 271 days. Have you received any prior offers? Is the seller open to a 34% concession, seller financing, or rate buy-down credit?
- Why hasn't it sold? Are there any deal-killer items the seller is aware of (foundation, flood, title, zoning, code violations)?
- Is there a deadline driving the sale (1031 exchange, divorce, estate, relocation)? That informs how much negotiation room exists.
- Schools are A-rated — typically a magnet for longer-tenancy family renters. What's the average tenant stay here, and is there a school-zone premium baked into asking?
- The area grade is low — what's the realistic commute time and amenity access for the typical tenant pool here? Any planned neighborhood developments (good or bad) we should know about?
- What's the average days-on-market for RENTAL listings here right now (not sales)? A rising rental-DOM trend means longer vacancies and softer asking-rent achievability than the comps imply.
- What's the recent tenant-quality profile in this submarket — average credit score on applications, eviction rate, late-payment / NSF rate, and stable-employment percentage? A property-management company in the area should have these aggregated.
CashFlowRE · CFR-DZ742WEQM24XKS
· Data 7 h ago
cashflowre.app · 2026-05-29