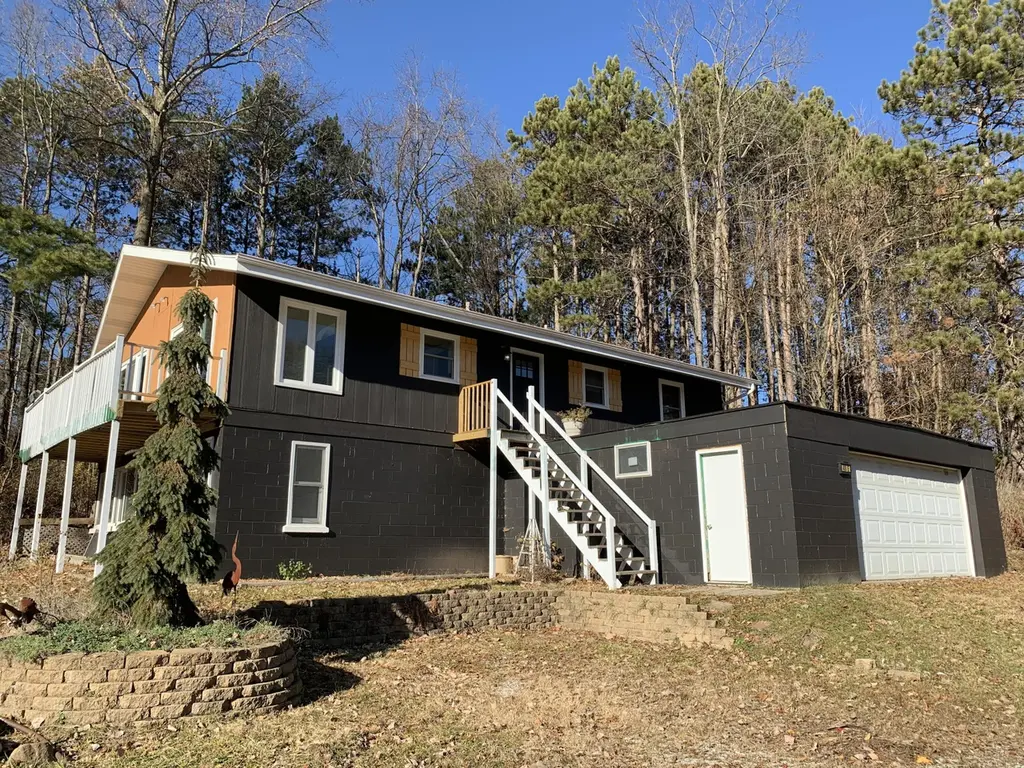
48 E Division Rd · Valparaiso, IN
Flood risk 1/10 · Minimal
- FEMA flood zone
- X (unshaded)
- Chance of flooding over 30 yrs
- 0.0%
- Est. flood insurance / yr
- $473 – $860
Fire risk 6/10 · Moderate
- Est. fire insurance / yr
- $717 – $1,331
Heat risk 2/10 · Minimal
- Hot days now (above 101°F)
- 7 days/yr
- Hot days in 30 yrs
- 16 days/yr
Wind risk 2/10 · Minimal
- Chance of severe wind over 30 yrs
- —
Air-quality risk 2/10 · Minimal
- Unhealthy air days now
- 1 days/yr
- Unhealthy air days in 30 yrs
- 1 days/yr
Risk factors via First Street. Map © Google.
Why this score? — see what drove the D grade
The composite is a weighted blend of 9 inputs, each scored 0–100. Each bar is that input's sub-score; the figure is the points it added to the 100-point composite (weight × sub-score).
- ARV discount +14.4/15.0
- Cash flow +8.6/30.0
- Schools +5.4/10.0
- Livability +4.1/5.0
- Rent growth +3.4/5.0
- Condition / age +2.5/5.0
- DSCR +2.4/10.0
- 1% rule +1.6/10.0
- Appreciation +0.0/10.0
$244,900
🖨 Deal sheet (PDF) 📄 Offer letter ✓ Due diligence
Listing remarks MLS
Just what you were waiting for. This 3 bedroom, 2 bath home sits on a half acre and gives you some room to roam. It's a great peaceful location. The home offers plenty of storage. You will enjoy the spacious family room, its great for entertaining or relaxing with family. The roof, gutters and sofit along with the windows are all new. Schedule your showing today!!!
Key facts
- 0.55 acre lot
- 3 garage spots
- Built 1982
Neighborhood map
What this means for you Summary
Snapshot
- This is a 3-bed/2.0-bath single-family listed at $245k.
Deal economics
- At list price, monthly cash flow is $-211 ($-3k/yr) — negative.
- To cash-flow at today's rent, offer at most $208k (15.2% below list).
- To meet the 1% rule (rent ≥ 1% of price), the offer needs to be $163k (33.6% below list).
- Recommended offer: $163k (33.6% below list) — sets the bar for 1% rule.
- Cap rate 5.3% vs local median 2.9% in Valparaiso — top-decile yield for the area; either an underpriced asset or a hidden risk that comps aren't pricing in. Stress-test before assuming the spread holds.
Location & tenants
- Location reads 82/100 on livability (#12 in IN, #1,149 nationally) — a professional / high-income tenant draw. Strengths: crime A+, cost of living A+, housing A+; Watch: amenities D-, commute F.
- East Porter County School Corporation (rural): math 58% / reading 63% proficiency, ranked #13 of 301 in IN (top 4%) — acceptable for families but not a draw, mixed tenant base, ~2y average lease; only 14% free/reduced lunch — higher-income household profile.
- Zoned schools: Morgan Township Elementary School (math 67% / reading 62%, grade B, #78 of 994 statewide, top 9%, 359 students, 12% FRL) — zoned schools at 12% FRL track the district average.
- Market conditions: Rents rising (+3.5%/yr); 260 active listings in the ZIP; solid renter incomes; 542 units permitted in Porter County in 2024 (0 in 5+ unit buildings).
Forward outlook
- Local home prices are declining (-3.0%/yr); year-one equity from $2k of loan paydown is wiped out by about $7k of value loss. Plan a longer hold.
- Porter County population projected at +6% by 2050 — modest demand growth; plan on rents tracking national, not racing it.
Negotiation context
- It's been on market 271 days — a 12% lower offer ($216k) is reasonable based on typical stale-listing flexibility.
- 2 sale attempts; this cycle's ask has dropped $25k (9%) from the opening price — seller is motivated, your offer sets the floor, not the list.
Risks & watch-outs
- Climate carrying-cost: major wildfire risk — expect insurance premiums to compound above CPI over the hold.
Questions for the listing agent
- What do current leases actually rent for vs. the listed asking? Can we see a recent rent roll and the last 12 months of T-12 income?
- It's been on market 271 days. Have you received any prior offers? Is the seller open to a 34% concession, seller financing, or rate buy-down credit?
- Why hasn't it sold? Are there any deal-killer items the seller is aware of (foundation, flood, title, zoning, code violations)?
- Is there a deadline driving the sale (1031 exchange, divorce, estate, relocation)? That informs how much negotiation room exists.
- Schools are A-rated — typically a magnet for longer-tenancy family renters. What's the average tenant stay here, and is there a school-zone premium baked into asking?
- The area grade is low — what's the realistic commute time and amenity access for the typical tenant pool here? Any planned neighborhood developments (good or bad) we should know about?
- What's the average days-on-market for RENTAL listings here right now (not sales)? A rising rental-DOM trend means longer vacancies and softer asking-rent achievability than the comps imply.
- What's the recent tenant-quality profile in this submarket — average credit score on applications, eviction rate, late-payment / NSF rate, and stable-employment percentage? A property-management company in the area should have these aggregated.
- How much new for-sale + rental construction is in the pipeline within 1–3 miles? Heavy new supply typically softens prices + rents 12–24 months out; constrained supply supports both.
Investment metrics
- 1% rule
- 0.66% ✗
- Cap rate
- 5.26%
- Cash-on-cash
- -3.69%
- DSCR
- 0.84
- GRM
- 12.5
CMA / ARV
- ARV (median comp)
- $289,606
- List price
- $244,900
- Delta
- -15.44%
- Verdict
- UNDERPRICED
- Comps
- 5 within 1.0 mi
Show comp detail 1 sale within ~0.75 mi
| Address | Dist | Beds/Ba | Sqft | Sold | Price | $/sf | Match |
|---|---|---|---|---|---|---|---|
| 3359 Blue Jay Dr | 0.52mi | 3/2.0 | 1,449 (+12%) | 7mo | $335,000 | $231 | 50 |
Match score weights: distance 35% · size 25% · config 20% · recency 20%. Top-matched comps best support the ARV.
Projected returns pro-forma
-3.0% appreciation · 3.52% rent growth · sell at horizon
- IRR
- -22.0%
- Equity multiple
- 0.24×
- Total profit
- $-52,341
- Equity at exit
- $36,515
- IRR
- -15.1%
- Equity multiple
- 0.13×
- Total profit
- $-59,695
- Equity at exit
- $21,174
Cash invested: $68,572 (down + closing). Projections, not guarantees.
Landlord ↔ Tenant lean methodology
- Overall (STATE)
- 90 Strongly Landlord-Friendly
- State Indiana
- 90 Strongly Landlord-Friendly · R+11
- County
- — inherits STATE
- City
- — inherits STATE
ZIP-level market 46383
- Rents YoY
- 3.5%
- Active inventory
- 260
- Price-to-rent
- 12.5×
Monthly cashflow live
- Estimated rent
- $1,627 medium interval (Pro) →
- Mortgage (P&I)
- −$1,284
- Tax from tax record
- −$110 /mo · $1,316/yr
- Insurance
- −$102
- HOA
- −$0
- Vacancy / Maint / Mgmt
- −$342
- Net cashflow
- $-211
Break-even live
Sensitivity live
| Price | -10% $-72 | -5% $-141 | +0% $-211 | +5% $-280 | +10% $-349 |
|---|---|---|---|---|---|
| Rent | -10% $-339 | -5% $-275 | +0% $-211 | +5% $-146 | +10% $-82 |
| Rate | -1.0pp $-87 | -0.5pp $-148 | base $-211 | +0.5pp $-274 | +1.0pp $-339 |
UW: 25.0% down · 7.5% · 30yr · 1.5% tax · 5.0% vac · 8.0% maint · 8.0% mgmt
Financing live
Cash to close
- Down payment
- $61,225
- Closing costs
- $7,347
- Reserves months
- —
- Total cash needed
- —
Loan-product check · same deal, 3 products live
Conventional
25% down · 7.5% · 30yr
- Down + closing
- —
- Monthly P&I
- —
- Monthly cashflow
- —
- DSCR
- —
- Eligible?
- —
Personal DTI + credit; lowest rate.
DSCR
20% down · 8.5% · 30yr
- Down + closing
- —
- Monthly P&I
- —
- Monthly cashflow
- —
- DSCR
- —
- Eligible?
- —
No personal income docs; deal must DSCR.
Hard money
10% down · 12.0% · 12mo
- Down + closing
- —
- Monthly P&I
- —
- Monthly cashflow
- —
- DSCR
- —
- Eligible?
- —
Short-term bridge; refi at stabilization.
Listing history 21 events
-
2026-06-22days on market $244,900 Active 271 DOM
-
2026-06-21days on market $244,900 Active 270 DOM
-
2026-06-18days on market $244,900 Active 267 DOM
-
2026-06-17days on market $244,900 Active 266 DOM
-
2026-06-16days on market $244,900 Active 265 DOM
-
2026-06-15days on market $244,900 Active 264 DOM
-
2026-06-13days on market $244,900 Active 262 DOM
-
2026-06-09days on market $244,900 Active 258 DOM
-
2026-06-08days on market $244,900 Active 257 DOM
-
2026-06-07days on market $244,900 Active 256 DOM
-
2026-06-04days on market $244,900 Active 253 DOM
-
2026-06-03days on market $244,900 Active 252 DOM
-
2026-06-02days on market $244,900 Active 251 DOM
-
2026-06-01days on market $244,900 Active 250 DOM
-
2026-05-31days on market $244,900 Active 249 DOM
-
2026-05-19price $244,900 367-char remark
Show marketing remark (367 chars)
Just what you were waiting for. This 3 bedroom, 2 bath home sits on a half acre and gives you some room to roam. It's a great peaceful location. The home offers plenty of storage. You will enjoy the spacious family room, its great for entertaining or relaxing with family. The roof, gutters and sofit along with the windows are all new. Schedule your showing today!!!
-
2026-01-27status Active 367-char remark
Show marketing remark (367 chars)
Just what you were waiting for. This 3 bedroom, 2 bath home sits on a half acre and gives you some room to roam. It's a great peaceful location. The home offers plenty of storage. You will enjoy the spacious family room, its great for entertaining or relaxing with family. The roof, gutters and sofit along with the windows are all new. Schedule your showing today!!!
-
2026-01-27status Pending 367-char remark
Show marketing remark (367 chars)
Just what you were waiting for. This 3 bedroom, 2 bath home sits on a half acre and gives you some room to roam. It's a great peaceful location. The home offers plenty of storage. You will enjoy the spacious family room, its great for entertaining or relaxing with family. The roof, gutters and sofit along with the windows are all new. Schedule your showing today!!!
-
2025-11-11price $249,900 367-char remark
Show marketing remark (367 chars)
Just what you were waiting for. This 3 bedroom, 2 bath home sits on a half acre and gives you some room to roam. It's a great peaceful location. The home offers plenty of storage. You will enjoy the spacious family room, its great for entertaining or relaxing with family. The roof, gutters and sofit along with the windows are all new. Schedule your showing today!!!
-
2025-10-08price $259,900 367-char remark
Show marketing remark (367 chars)
Just what you were waiting for. This 3 bedroom, 2 bath home sits on a half acre and gives you some room to roam. It's a great peaceful location. The home offers plenty of storage. You will enjoy the spacious family room, its great for entertaining or relaxing with family. The roof, gutters and sofit along with the windows are all new. Schedule your showing today!!!
-
2025-09-24$269,900 Active 367-char remark
Show marketing remark (367 chars)
Just what you were waiting for. This 3 bedroom, 2 bath home sits on a half acre and gives you some room to roam. It's a great peaceful location. The home offers plenty of storage. You will enjoy the spacious family room, its great for entertaining or relaxing with family. The roof, gutters and sofit along with the windows are all new. Schedule your showing today!!!
ⓘ Source: listings_history table (triggers on properties + properties_extension) + one-shot
backfill from property_details.listing_events for pre-trigger history.
Tax reassessment forecast IN · Partial reset (capped growth)
- Current annual tax
- $1,316 · $110/mo
- Projected year-2 tax
- $1,699 · $142/mo
- Expected delta
- +$383/yr (+$32/mo · 29.1%)
ⓘ Screening estimate from a state-policy table — verify with the county assessor before closing.
Climate risk First Street
- Flood 1/10 Low FEMA zone X (unshaded) · 0% chance over 30 yrs
- Wildfire 6/10 Major
- Heat 2/10 Low 7 d/yr ≥101°F today · 16 d/yr by 30 yrs out
- Wind 2/10 Low
- Air quality 2/10 Low 1 unhealthy d/yr today · 1 by 30 yrs out
Nearby sold comps map
Loading sold comps map…
Walkable amenities ~0.75 mi
Loading nearby amenities…
Taxation est. · year 1
- Rental income
- $19,524
- − Mortgage interest
- −$13,718
- − Property taxes
- −$1,316
- − Insurance
- −$1,224
- − Repairs & maintenance
- −$1,562
- − Management
- −$1,562
- − Depreciation
- −$7,124
- Taxable loss
- −$6,983
- Est. tax savings @ 24.0%
- +$1,676
- After-tax cash flow
- $-852/yr
For passive investors: Depreciation is non-cash, so a rental often shows a tax loss while cash-flowing — sheltering income. Rental losses are passive: they offset passive income freely, and up to $25,000/yr can offset ordinary (W-2) income if you actively participate and your MAGI is under $100k (phasing out to $0 by $150k); unused losses carry forward. On sale, claimed depreciation is recaptured at up to 25%, and gains may owe capital-gains tax (a 1031 exchange can defer both). Figures are a year-1 estimate at your 24.0% rate — not tax advice; consult a CPA.
Schools (NCES district)
- District
- East Porter County School Corporation
- NCES district ID
- 1809000
- Math proficiency
- 58% ▼ -3.00%
- Reading proficiency
- 63% ▼ -3.00%
- Median HH income
- $72,060
- Composite
- 53.58/100
- National rank
- #1441
- State rank
- #13 of 301 in IN
Livability — Valparaiso
- Score
- 82/100
- State rank
- #12
- US rank
- #1149
Category grades
Schools grade is shown separately in the Schools card above.
Census & demographics
- County
- Porter County · 151,647 people
- City population
- 83,039
- Metro
- Chicago-Naperville-Elgin, IL-IN-WI
- Population (ZIP)
- 42,183
- Household income
- $76,224
- Rent vs Own
- Severe rent burden
- 1478.0
Population outlook (Porter County) Hauer SSP2
- Today (2025)
- 177,804 people
- By 2030
- 181,552 · +2.1%
- By 2040
- 185,830 · +4.5%
- By 2050
- 187,498 · +5.5%
- By 2075
- 189,585 · +6.6%
- By 2100
- 183,722 · +3.3%
Race, ethnicity, and origin ACS 2023
- Neighborhood character
- Predominantly White (84%)
- Race & ethnicity
- White 84% Hispanic / Latino 9% Two or more races 6% Black 2% Asian 1%
- Hispanic origin (detail)
- Mexican 6%
- Common ancestry
- Romanian 9% Lithuanian 3% Slovak 3%
- Foreign-born
- 4% · Canada
- Languages at home
- 95% English-only · Spanish 3%
Political lean MEDSL · Porter
- 2024 margin
- R (+10.5) · D 43.8% · R 54.3% · Other 1.8%
- 2008→2024 swing
- -17.7pp toward R · 2008: 7.2pp · 2024: -10.5pp
- All cycles
- 2024: R+10.5 2020: R+6.1 2016: R+6.8 2012: D+3.8 2008: D+7.2
Not yet ingested
- Civics
- —
Market trends
- HPI YoY
- ▼ -151.84%
- Current HPI
- 197.9925
- Rent YoY
- ▲ 3.52%
- Metro
- Chicago-Naperville-Elgin, IL-IN-WI
- State GDP YoY
- ▲ 2.90%
- F500 in state
- 18
Industry mix (Fortune 500 HQ in IN)
| Industry | F500 HQs | Revenue |
|---|---|---|
| Industrial Machinery | 2 | $37B |
|
||
| Healthcare | 1 | $177B |
|
||
| Pharmaceuticals | 1 | $45B |
|
||
| Metals / Steel | 1 | $18B |
|
||
| Agriculture | 1 | $17B |
|
||
| Packaging | 1 | $12B |
|
||
Price history
-9.3% since first listed6 events — show timeline
- 2026-05-19 Price Changed $244,900 NIRA MLS as Distributed by MLS Grid
- 2026-01-27 Relisted — NIRA MLS as Distributed by MLS Grid
- 2026-01-27 Pending — NIRA MLS as Distributed by MLS Grid
- 2025-11-11 Price Changed $249,900 NIRA MLS as Distributed by MLS Grid
- 2025-10-08 Price Changed $259,900 NIRA MLS as Distributed by MLS Grid
- 2025-09-24 Listed $269,900 NIRA MLS as Distributed by MLS Grid
Property tax history
+4.8%/yrLatest (2024): $1,316 · +11.7% YoY. Source: county tax records.
Cash-flow waterfall
monthlySold comps — $/sqft
last 12 mo · ≤1 miLoading sold comps…