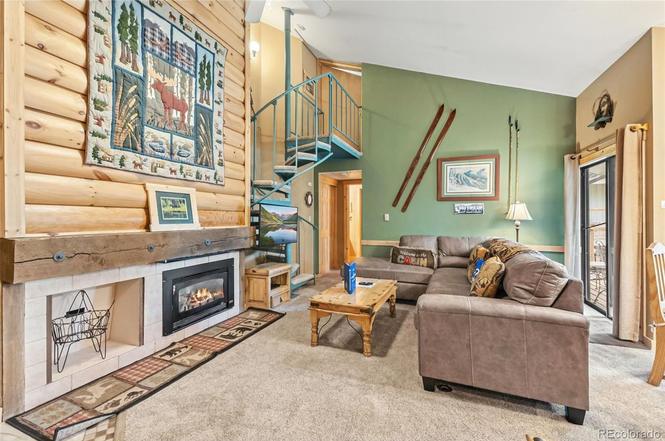
1937 Soda Ridge Rd #1126
Keystone, CO 80435
$172,500B-
1 bd · 1.0 ba ·
991 sqft ·
Built 1973
· Condo
· Active
· 311 DOM
Cashflow @ list (25.0% down · 7.5%)
Estimated rent
$3,055/mo
Mortgage (P&I)
−$905
Tax + insurance
−$252
HOA
−$333
Vac / Maint / Mgmt
−$642
Net cashflow
$924/mo
Annual
$11,084/yr
Cap rate
12.72%
Cash-on-cash
22.95%
DSCR
2.02
1% rule
1.77%
Cash to close
$48,300
Investor read
- This is a 1-bed/1.0-bath condo listed at $172k.
- At list price, monthly cash flow is $924 ($11k/yr) — positive.
- The deal already cash-flows at list — no discount required.
- Meets the 1% rule at list price ($3k rent vs $172k).
- It's been on market 311 days — a 12% lower offer ($152k) is reasonable based on typical stale-listing flexibility.
- Recommended offer: $152k (12.0% below list) — sets the bar for market timing.
- Local home prices are declining (-3.0%/yr); year-one equity from $1k of loan paydown is wiped out by about $5k of value loss. Plan a longer hold.
- Location reads 49/100 on livability (#412 in CO) — a working-class tenant base; expect higher turnover. Strengths: crime A-; Watch: commute C-, amenities F, cost of living F.
- Summit School District No. RE-1 (rural): math 27% / reading 43% proficiency, ranked #35 of 86 in CO (top 41%) — families likely to look elsewhere, expect single-tenant / working-renter base with shorter leases.
- Zoned schools: Summit Cove Elementary School (math 44% / reading 47%, grade D-, #268 of 966 statewide, top 28%, 226 students, 32% FRL); Summit Middle School (math 24% / reading 38%, grade F, #126 of 270 statewide, top 46%, 764 students, 38% FRL); Summit High School (math 37% / reading 62%, grade D, #115 of 381 statewide, top 34%, 1,132 students, 29% FRL).
- Market conditions: 409 active listings in the ZIP; 2 comparable units currently listed for rent nearby; solid renter incomes; 308 units permitted in Summit County in 2024 (123 in 5+ unit buildings).
- Summit County population projected at +32% by 2050 — long-run rental-demand tailwind backs the buy-and-hold thesis.
- 14 sale attempts since 10y ago; this cycle's ask has dropped $22k (12%) from the opening price — seller is motivated, your offer sets the floor, not the list.
- At projected returns (-3.0% appreciation + 3.0% rent growth), your $48k cash investment doubles in ~6 years — after that, you're playing with house money.
- Cap rate 12.7% vs local median 0.4% in Keystone — top-decile yield for the area; either an underpriced asset or a hidden risk that comps aren't pricing in. Stress-test before assuming the spread holds.
- This rent runs 38% of the median local income ($97k/yr) — at the standard rent-burdened threshold; future hikes will face affordability resistance.
Questions for listing agent
- It's been on market 311 days. Have you received any prior offers? Is the seller open to a 12% concession, seller financing, or rate buy-down credit?
- Built in 1973 — when were the roof, HVAC, electrical panel, plumbing, and water heater last replaced?
- What does the HOA fee cover, when was the last increase, and are there any pending special assessments or reserve-fund shortfalls?
- Any open or pending special assessments — roof, HVAC, plumbing, elevator, façade? What's the per-unit balance and payoff schedule, and is the seller paying it off at close or rolling it to the buyer?
- Why hasn't it sold? Are there any deal-killer items the seller is aware of (foundation, flood, title, zoning, code violations)?
- Is there a deadline driving the sale (1031 exchange, divorce, estate, relocation)? That informs how much negotiation room exists.
- What's the average days-on-market for RENTAL listings here right now (not sales)? A rising rental-DOM trend means longer vacancies and softer asking-rent achievability than the comps imply.
- What's the recent tenant-quality profile in this submarket — average credit score on applications, eviction rate, late-payment / NSF rate, and stable-employment percentage? A property-management company in the area should have these aggregated.
CashFlowRE · CFR-E2RY652B8CS3BD
· Data 1 day ago
cashflowre.app · 2026-05-29