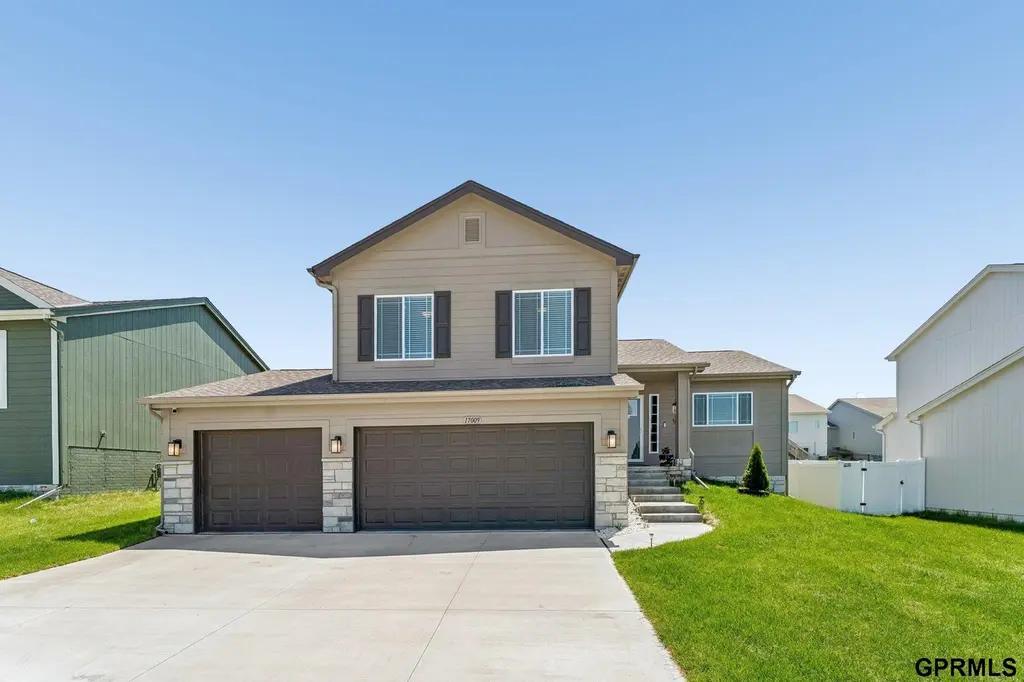
17009 Huntington Ave
Omaha, NE 68116
$371,900D-
3 bd · 2.5 ba ·
1,888 sqft ·
Built 2024
· Other
· Pending
· 11 DOM
Cashflow @ list (25.0% down · 7.5%)
Estimated rent
$2,714/mo
Mortgage (P&I)
−$1,950
Tax + insurance
−$801
HOA
−$10
Vac / Maint / Mgmt
−$570
Net cashflow
$-617/mo
Annual
$-7,405/yr
Cap rate
4.30%
Cash-on-cash
-7.11%
DSCR
0.68
1% rule
0.73%
Cash to close
$104,132
Investor read
- This is a 3-bed/2.5-bath other listed at $372k.
- At list price, monthly cash flow is $-617 ($-7k/yr) — negative.
- To cash-flow at today's rent, offer at most $263k (29.3% below list).
- To meet the 1% rule (rent ≥ 1% of price), the offer needs to be $271k (27.0% below list).
- Only 11 days on market — expect competitive offers; lowballing is unlikely to land.
- Recommended offer: $263k (29.3% below list) — sets the bar for cash-flow.
- Local home prices are declining (-3.0%/yr); year-one equity from $3k of loan paydown is wiped out by about $11k of value loss. Plan a longer hold.
- Location reads 84/100 on livability (#7 in NE, #663 nationally) — a professional / high-income tenant draw. Strengths: amenities A+, commute A+, cost of living A+; Watch: crime F.
- Bennington Public Schools (rural): math 67% / reading 67% proficiency, ranked #3 of 111 in NE (top 3%) — acceptable for families but not a draw, mixed tenant base, ~2y average lease; only 6% free/reduced lunch — higher-income household profile.
- Zoned schools: Anchor Pointe Elementary (math 65% / reading 71%, grade B+, #63 of 502 statewide, top 12%, 475 students, 8% FRL); Bennington Middle School (math 64% / reading 63%, grade B+, #13 of 128 statewide, top 10%, 410 students, 19% FRL); Bennington High School (math 66% / reading 70%, grade B, #21 of 261 statewide, top 8%, 1,002 students, 14% FRL).
- Market conditions: Rents rising (+2.5%/yr); 169 active listings in the ZIP; 6 comparable units currently listed for rent nearby; rentals leasing fast (median 2d on market — plan ~1-2 weeks tenant-placement turnaround); high-income renter base; 4,539 units permitted in Douglas County in 2024 (2,583 in 5+ unit buildings).
- Douglas County population projected at +28% by 2050 — long-run rental-demand tailwind backs the buy-and-hold thesis.
- 4 sale attempts since 3y ago with the ask held roughly flat each time — persistent listings suggest the price (not the market) is what's stuck; bring a comps-based counter.
Questions for listing agent
- What do current leases actually rent for vs. the listed asking? Can we see a recent rent roll and the last 12 months of T-12 income?
- What does the HOA fee cover, when was the last increase, and are there any pending special assessments or reserve-fund shortfalls?
- Is there a deadline driving the sale (1031 exchange, divorce, estate, relocation)? That informs how much negotiation room exists.
- Crime grade is F in this area — have there been break-ins, vandalism, or insurance claims at this property in the last 3 years? What carrier currently insures it and at what premium?
- The area grade is low — what's the realistic commute time and amenity access for the typical tenant pool here? Any planned neighborhood developments (good or bad) we should know about?
- What's the average days-on-market for RENTAL listings here right now (not sales)? A rising rental-DOM trend means longer vacancies and softer asking-rent achievability than the comps imply.
- What's the recent tenant-quality profile in this submarket — average credit score on applications, eviction rate, late-payment / NSF rate, and stable-employment percentage? A property-management company in the area should have these aggregated.
- How much new for-sale + rental construction is in the pipeline within 1–3 miles? Heavy new supply typically softens prices + rents 12–24 months out; constrained supply supports both.
CashFlowRE · CFR-E3TSED272J8A8C
· Data 2 days ago
cashflowre.app · 2026-05-29