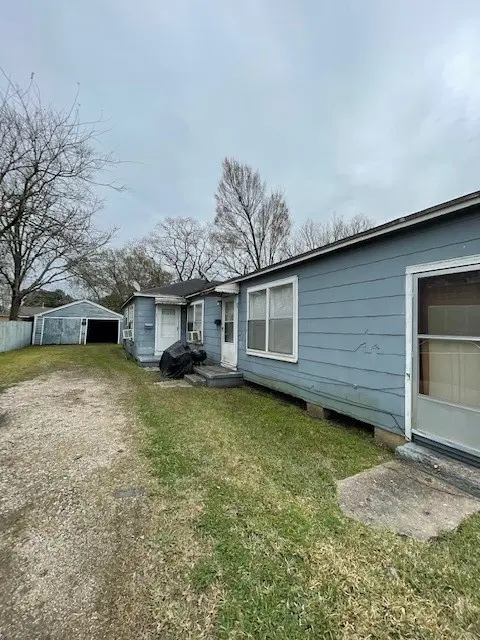
307 S Kansas St
La Porte, TX 77571
$160,000B
4 bd · 2.0 ba ·
1,625 sqft ·
Built 1944
· MultiFamily
· Active
· 10 DOM
Cashflow @ list (25.0% down · 7.5%)
Estimated rent
$2,457/mo
Mortgage (P&I)
−$839
Tax + insurance
−$453
HOA
−$0
Vac / Maint / Mgmt
−$516
Net cashflow
$649/mo
Annual
$7,793/yr
Cap rate
11.66%
Cash-on-cash
19.17%
DSCR
1.85
1% rule
1.54%
Cash to close
$44,800
Investor read
- This is a 2 × 2-bed/1.0-bath units multifamily listed at $160k.
- At list price, monthly cash flow is $649 ($8k/yr) — positive. Per door: $325/mo.
- The deal already cash-flows at list — no discount required.
- Meets the 1% rule at list price ($2k rent vs $160k).
- Only 10 days on market — expect competitive offers; lowballing is unlikely to land.
- Local home prices are declining (-3.0%/yr); year-one equity from $1k of loan paydown is wiped out by about $5k of value loss. Plan a longer hold.
- Location reads 70/100 on livability (#360 in TX) — a middle-class / working-renter tenant base. Strengths: cost of living A+, housing A+, crime A-; Watch: schools D+, amenities F, commute F.
- La Porte ISD (suburban): math 41% / reading 44% proficiency, ranked #260 of 826 in TX (top 32%) — families likely to look elsewhere, expect single-tenant / working-renter base with shorter leases.
- Watch-outs: flood insurance adds $66/mo; built in 1944 — expect roof / HVAC / electrical / plumbing capex.
- Market conditions: Rents rising (+2.8%/yr); 337 active listings in the ZIP; 3 comparable units currently listed for rent nearby; rentals at typical pace (median 24d on market — plan ~3-4 weeks tenant-placement turnaround); solid renter incomes; 29,883 units permitted in Harris County in 2024 (8,621 in 5+ unit buildings).
- Harris County population projected at +47% by 2050 — long-run rental-demand tailwind backs the buy-and-hold thesis.
- 5 sale attempts since 4y ago; this cycle's ask is 33% above the opening price — seller raised mid-cycle; expect resistance to lowballs.
- At projected returns (-3.0% appreciation + 2.8% rent growth), your $45k cash investment doubles in ~7 years — after that, you're playing with house money.
- Climate carrying-cost: major flood risk; severe wind risk, 99% chance of damaging wind over 30y; extreme-heat days projected 7→25/yr by 2055 (HVAC capex compounding) — expect insurance premiums to compound above CPI over the hold.
- Cap rate 11.7% vs local median 3.4% in La Porte — top-decile yield for the area; either an underpriced asset or a hidden risk that comps aren't pricing in. Stress-test before assuming the spread holds.
- This rent runs 36% of the median local income ($82k/yr) — at the standard rent-burdened threshold; future hikes will face affordability resistance.
Questions for listing agent
- Can we see the unit-by-unit rent roll, current vacancy, and any below-market leases? What's the average tenancy length?
- What capital expenditures (roof, boiler, parking lot, exteriors) have been made in the last 5 years, and what's planned in the next 2?
- Built in 1944 — when were the roof, HVAC, electrical panel, plumbing, and water heater last replaced?
- What's the actual annual flood-insurance premium (NFIP or private), and is the property in a SFHA with mandatory coverage?
- Is there a deadline driving the sale (1031 exchange, divorce, estate, relocation)? That informs how much negotiation room exists.
- Schools are D-rated, which usually means shorter tenancies and higher turnover. Who's the typical renter profile here, and what's been the actual vacancy rate?
- What's the average days-on-market for RENTAL listings here right now (not sales)? A rising rental-DOM trend means longer vacancies and softer asking-rent achievability than the comps imply.
- What's the recent tenant-quality profile in this submarket — average credit score on applications, eviction rate, late-payment / NSF rate, and stable-employment percentage? A property-management company in the area should have these aggregated.
CashFlowRE · CFR-E50VR37FNFBCQ5
· Data 2 days ago
cashflowre.app · 2026-05-29