 Duplex
307 S Kansas St · La Porte, TX
Flood risk 7/10 · Major
- FEMA flood zone
- X (shaded)
- Chance of flooding over 30 yrs
- 0.71%
- Est. flood insurance / yr
- $507 – $1,088
Fire risk 1/10 · Minimal
- Est. fire insurance / yr
- $1,222 – $2,270
Heat risk 9/10 · Severe
- Hot days now (above 108°F)
- 7 days/yr
- Hot days in 30 yrs
- 25 days/yr
Wind risk 9/10 · Severe
- Chance of severe wind over 30 yrs
- 99.0%
Air-quality risk 2/10 · Minimal
- Unhealthy air days now
- 1 days/yr
- Unhealthy air days in 30 yrs
- 2 days/yr
Risk factors via First Street. Map © Google.
Why this score? — see what drove the B grade
The composite is a weighted blend of 9 inputs, each scored 0–100. Each bar is that input's sub-score; the figure is the points it added to the 100-point composite (weight × sub-score).
- Cash flow +30.0/30.0
- 1% rule +10.0/10.0
- DSCR +10.0/10.0
- ARV discount +7.5/15.0
- Schools +3.9/10.0
- Livability +3.5/5.0
- Rent growth +3.2/5.0
- Condition / age +2.5/5.0
- Appreciation +0.0/10.0
$160,000
🖨 Deal sheet 📄 Offer letter ✓ Due diligence
Multi-family units
County records classify this as Multi-Family (2-4 Unit). Listing-text estimate: 2 units. confirmed
Listing remarks MLS
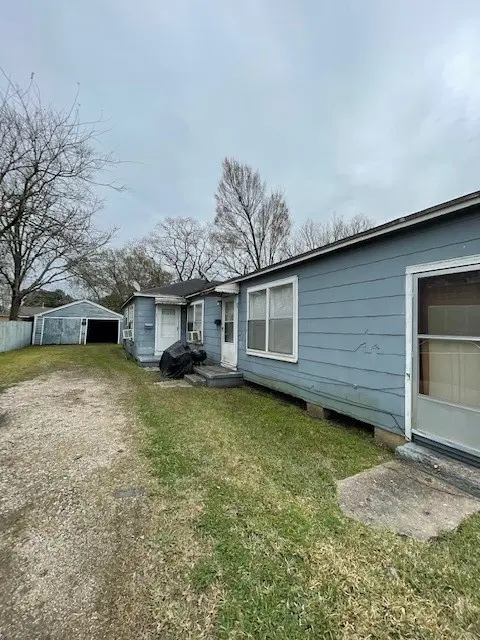
Location is Key!. Come see this 2 bedroom 1 bath duplex. The front unit is occupied and the rear unit is vacant
Key facts
- Convenient location
- Duplex
- 7,812 sq ft lot
Tags
Property features AI
Finance
- Financial info: Annual tax noted (2025)
Exterior
- Utilities: Electric heating and cooling
- Home design: Built in 1944; Property type: Residential Income
- Construction: 1944 construction; Composition roofing
- Exterior features: Lot size about 7,812 square feet; Composition roof
Interior
- Bedrooms: Each unit has 2 bedrooms (2 units total)
- Bathrooms: 1 full bathroom (total)
- Heating & cooling: Central heating (electric); Central air conditioning (electric)
- Interior features: Residential income property with two separate units; Total building area approximately 1,625
Neighborhood map
What this means for you Summary
Snapshot
- This is a 2 × 2-bed/1.0-bath units multifamily listed at $160k.
Deal economics
- At list price, monthly cash flow is $649 ($8k/yr) — positive. Per door: $325/mo.
- The deal already cash-flows at list — no discount required.
- Meets the 1% rule at list price ($2k rent vs $160k).
- Cap rate 11.7% vs local median 3.4% in La Porte — top-decile yield for the area; either an underpriced asset or a hidden risk that comps aren't pricing in. Stress-test before assuming the spread holds.
Location & tenants
- Location reads 70/100 on livability (#360 in TX) — a middle-class / working-renter tenant base. Strengths: cost of living A+, housing A+, crime A-; Watch: schools D+, amenities F, commute F.
- La Porte ISD (suburban): math 41% / reading 44% proficiency, ranked #260 of 826 in TX (top 32%) — families likely to look elsewhere, expect single-tenant / working-renter base with shorter leases.
- Market conditions: Rents rising (+2.8%/yr); 337 active listings in the ZIP; 3 comparable units currently listed for rent nearby; rentals at typical pace (median 24d on market — plan ~3-4 weeks tenant-placement turnaround); solid renter incomes; 29,883 units permitted in Harris County in 2024 (8,621 in 5+ unit buildings).
- This rent runs 36% of the median local income ($82k/yr) — at the standard rent-burdened threshold; future hikes will face affordability resistance.
Forward outlook
- Local home prices are declining (-3.0%/yr); year-one equity from $1k of loan paydown is wiped out by about $5k of value loss. Plan a longer hold.
- Harris County population projected at +47% by 2050 — long-run rental-demand tailwind backs the buy-and-hold thesis.
- At projected returns (-3.0% appreciation + 2.8% rent growth), your $45k cash investment doubles in ~7 years — after that, you're playing with house money.
Negotiation context
- Only 10 days on market — expect competitive offers; lowballing is unlikely to land.
- 5 sale attempts since 4y ago; this cycle's ask is 33% above the opening price — seller raised mid-cycle; expect resistance to lowballs.
Risks & watch-outs
- Watch-outs: flood insurance adds $66/mo; built in 1944 — expect roof / HVAC / electrical / plumbing capex.
- Climate carrying-cost: major flood risk; severe wind risk, 99% chance of damaging wind over 30y; extreme-heat days projected 7→25/yr by 2055 (HVAC capex compounding) — expect insurance premiums to compound above CPI over the hold.
Questions for the listing agent
- Can we see the unit-by-unit rent roll, current vacancy, and any below-market leases? What's the average tenancy length?
- What capital expenditures (roof, boiler, parking lot, exteriors) have been made in the last 5 years, and what's planned in the next 2?
- Built in 1944 — when were the roof, HVAC, electrical panel, plumbing, and water heater last replaced?
- What's the actual annual flood-insurance premium (NFIP or private), and is the property in a SFHA with mandatory coverage?
- Is there a deadline driving the sale (1031 exchange, divorce, estate, relocation)? That informs how much negotiation room exists.
- Schools are D-rated, which usually means shorter tenancies and higher turnover. Who's the typical renter profile here, and what's been the actual vacancy rate?
- What's the average days-on-market for RENTAL listings here right now (not sales)? A rising rental-DOM trend means longer vacancies and softer asking-rent achievability than the comps imply.
- What's the recent tenant-quality profile in this submarket — average credit score on applications, eviction rate, late-payment / NSF rate, and stable-employment percentage? A property-management company in the area should have these aggregated.
- How much new apartment / multifamily construction is in the pipeline within 1–3 miles? Heavy new supply (>2% of stock underway) typically softens rents 12–24 months out; light construction supports rent growth.
Investment metrics
- 1% rule
- 1.54% ✓
- Cap rate
- 11.66%
- Cash-on-cash
- 19.17%
- DSCR
- 1.85
- GRM
- 5.4
CMA / ARV
No comps found within radius.
Projected returns pro-forma
-3.0% appreciation · 2.81% rent growth · sell at horizon
- IRR
- 8.6%
- Equity multiple
- 1.34×
- Total profit
- $15,115
- Equity at exit
- $23,857
- IRR
- 17.7%
- Equity multiple
- 2.45×
- Total profit
- $65,118
- Equity at exit
- $13,834
Cash invested: $44,800 (down + closing). Projections, not guarantees.
Landlord ↔ Tenant lean methodology
- Overall (STATE)
- 87 Strongly Landlord-Friendly
- State Texas
- 87 Strongly Landlord-Friendly · R+5
- County
- — inherits STATE
- City
- — inherits STATE
ZIP-level market 77571
- Home prices YoY
- -28.9%
- Rents YoY
- 2.8%
- Active inventory
- 337
- Price-to-rent
- 10.9×
Monthly cashflow live
- Estimated rent
- $2,457 medium interval (Pro) →
- Mortgage (P&I)
- −$839
- Tax from tax record
- −$319 /mo · $3,834/yr
- Insurance
- −$67
- Flood insurance flood zone
- −$66 /mo · $798/yr
- HOA
- −$0
- Vacancy / Maint / Mgmt
- −$516
- Net cashflow
- $649
Break-even live
2-unit breakdown (identical units grouped — click to expand)
| Units | Beds | Baths | Est. rent |
|---|---|---|---|
| 2× units | 2 | 1 | $2,458 |
| #1 | 2 | 1 | $1,229 |
| #2 | 2 | 1 | $1,229 |
| Total (2 units) | $2,457 | ||
UW: 25.0% down · 7.5% · 30yr · 1.5% tax · 5.0% vac · 8.0% maint · 8.0% mgmt
Financing live
Cash to close
- Down payment
- $40,000
- Closing costs
- $4,800
- Reserves months
- —
- Total cash needed
- —
Loan-product check · same deal, 3 products live
Conventional
25% down · 7.5% · 30yr
- Down + closing
- —
- Monthly P&I
- —
- Monthly cashflow
- —
- DSCR
- —
- Eligible?
- —
Personal DTI + credit; lowest rate.
DSCR
20% down · 8.5% · 30yr
- Down + closing
- —
- Monthly P&I
- —
- Monthly cashflow
- —
- DSCR
- —
- Eligible?
- —
No personal income docs; deal must DSCR.
Hard money
10% down · 12.0% · 12mo
- Down + closing
- —
- Monthly P&I
- —
- Monthly cashflow
- —
- DSCR
- —
- Eligible?
- —
Short-term bridge; refi at stabilization.
Rent comps 3 comps
| Address | Beds | Baths | Sqft | Rent | $/sqft | DOM | Units | Dist |
|---|---|---|---|---|---|---|---|---|
| 319 S 6th St La Porte, TX | 4.0 | 2.0 | 1812 | $1,795 | $0.99 | 24d | 1 | 0.64mi |
| 218 S 6th St La Porte, TX | 3.0 | 2.0 | 1500 | $1,925 | $1.28 | 43d | 1 | 0.65mi |
| 803 S 4th St La Porte, TX | 4.0 | 1.5 | 1688 | $1,700 | $1.01 | 5d | 1 | 0.72mi |
Listing history 8 events
-
2026-06-18days on market $160,000 Active 10 DOM
-
2026-06-17days on market $160,000 Active 9 DOM
-
2026-06-16days on market $160,000 Active 8 DOM
-
2026-06-15days on market $160,000 Active 7 DOM
-
2026-06-13days on market $160,000 Active 5 DOM
-
2026-06-10price $160,000 Active 1 DOM
-
2026-06-04remarks 323-char remark
-
2026-06-04$120,000 Active 1 DOM
ⓘ Source: listings_history table (triggers on properties + properties_extension) + one-shot
backfill from property_details.listing_events for pre-trigger history.
Tax reassessment forecast TX · Resets to sale price
- Current annual tax
- $3,834 · $319/mo
- Projected year-2 tax
- $3,834 · $319/mo
- Expected delta
- $0/yr ($0/mo · -0.0%)
ⓘ Screening estimate from a state-policy table — verify with the county assessor before closing.
Climate risk First Street
- Flood 7/10 Severe FEMA zone X (shaded) · 71% chance over 30 yrs
- Wildfire 1/10 Low
- Heat 9/10 Extreme 7 d/yr ≥108°F today · 25 d/yr by 30 yrs out
- Wind 9/10 Extreme 99% chance of damaging wind over 30 yrs
- Air quality 2/10 Low 1 unhealthy d/yr today · 2 by 30 yrs out
Nearby sold comps map
Loading sold comps map…
Walkable amenities ~0.75 mi
Loading nearby amenities…
Taxation est. · year 1
- Rental income
- $29,484
- − Mortgage interest
- −$8,962
- − Property taxes
- −$3,834
- − Insurance
- −$1,598
- − Repairs & maintenance
- −$2,359
- − Management
- −$2,359
- − Depreciation
- −$4,655
- Taxable income
- $5,719
- Est. tax owed @ 24.0%
- −$1,372
- After-tax cash flow
- $6,420/yr
For passive investors: Depreciation is non-cash, so a rental often shows a tax loss while cash-flowing — sheltering income. Rental losses are passive: they offset passive income freely, and up to $25,000/yr can offset ordinary (W-2) income if you actively participate and your MAGI is under $100k (phasing out to $0 by $150k); unused losses carry forward. On sale, claimed depreciation is recaptured at up to 25%, and gains may owe capital-gains tax (a 1031 exchange can defer both). Figures are a year-1 estimate at your 24.0% rate — not tax advice; consult a CPA.
Schools (NCES district)
- District
- La Porte ISD
- NCES district ID
- 4826190
- Math proficiency
- 41% ▼ -10.00%
- Reading proficiency
- 44% ▼ -4.00%
- Median HH income
- $71,841
- Composite
- 38.65/100
- National rank
- #4151
- State rank
- #260 of 826 in TX
Livability — La Porte
- Score
- 70/100
- State rank
- #360
- US rank
- #7754
Category grades
Schools grade is shown separately in the Schools card above.
Census & demographics
- Census place
- La Porte, TX
- County
- Harris County · 4,702,590 people
- City population
- 38,543
- Metro
- Houston-The Woodlands-Sugar Land, TX
- Population (ZIP)
- 38,543
- Household income
- $81,850
- Rent vs Own
- Severe rent burden
- 1176.0
Population outlook (Harris County) Hauer SSP2
- Today (2025)
- 5,571,493 people
- By 2030
- 6,089,821 · +9.3%
- By 2040
- 7,142,806 · +28.2%
- By 2050
- 8,185,864 · +46.9%
- By 2075
- 10,574,329 · +89.8%
- By 2100
- 12,109,958 · +117.4%
Race, ethnicity, and origin ACS 2023
- Neighborhood character
- Diverse neighborhood (Simpson 0.60)
- Race & ethnicity
- White 51% Hispanic / Latino 36% Two or more races 20% Black 8% Asian 1%
- Hispanic origin (detail)
- Mexican 31%
- Common ancestry
- Italian 4% Lithuanian 3% Iranian 1%
- Foreign-born
- 10% · Canada, Vietnam
- Languages at home
- 77% English-only · Spanish 21% Other Indo-European 1%
Political lean MEDSL · Harris
- 2024 margin
- Lean D (+5.5) · D 52.0% · R 46.4% · Other 1.6%
- 2008→2024 swing
- +3.9pp toward D · 2008: 1.6pp · 2024: 5.5pp
- All cycles
- 2024: D+5.5 2020: D+13.3 2016: D+12.4 2012: D+0.1 2008: D+1.6
Not yet ingested
- Civics
- —
Market trends
- HPI YoY
- ▼ -103.81%
- Current HPI
- 255.0768
- Rent YoY
- ▲ 2.81%
- Metro
- Houston-The Woodlands-Sugar Land, TX
- State GDP YoY
- ▲ 3.95%
- F500 in state
- 110
Industry mix (Fortune 500 HQ in TX)
| Industry | F500 HQs | Revenue |
|---|---|---|
| Energy | 16 | $1,198B |
|
||
| Technology | 5 | $198B |
|
||
| Engineering / Construction | 4 | $72B |
|
||
| Energy Services | 3 | $60B |
|
||
| Utilities | 3 | $41B |
|
||
| Healthcare | 2 | $330B |
|
||
Price history
-20.0% since first listed19 events — show timeline
- 2026-06-04 Listing Removed — HARMLS
- 2026-06-03 Listed $120,000 HARMLS
- 2024-06-11 Relisted — HARMLS
- 2024-06-11 Pending — HARMLS
- 2024-05-31 Listing Removed — HARMLS
- 2024-05-29 Pending — HARMLS
- 2024-04-23 Price Changed $165,000 HARMLS
- 2024-01-23 Listed $175,000 HARMLS
- 2024-01-17 Coming Soon — HARMLS
- 2022-04-27 Sold (Public Records) — Public Records
- 2022-03-06 Pending — HARMLS
- 2022-02-24 Pending — HARMLS
- 2022-02-22 Sold (MLS) — HARMLS
- 2022-02-19 Relisted — HARMLS
- 2022-02-11 Pending — HARMLS
- 2022-01-22 Price Changed $150,000 HARMLS
- 2022-01-10 Price Changed $165,000 HARMLS
- 2022-01-09 Listed $150,000 HARMLS
- 1994-10-06 Sold (Public Records) — Public Records
Property tax history
+3.5%/yrLatest (2025): $3,834 · +3.1% YoY. Source: county tax records.
Cash-flow waterfall
monthlySold comps — $/sqft
last 12 mo · ≤1 miLoading sold comps…