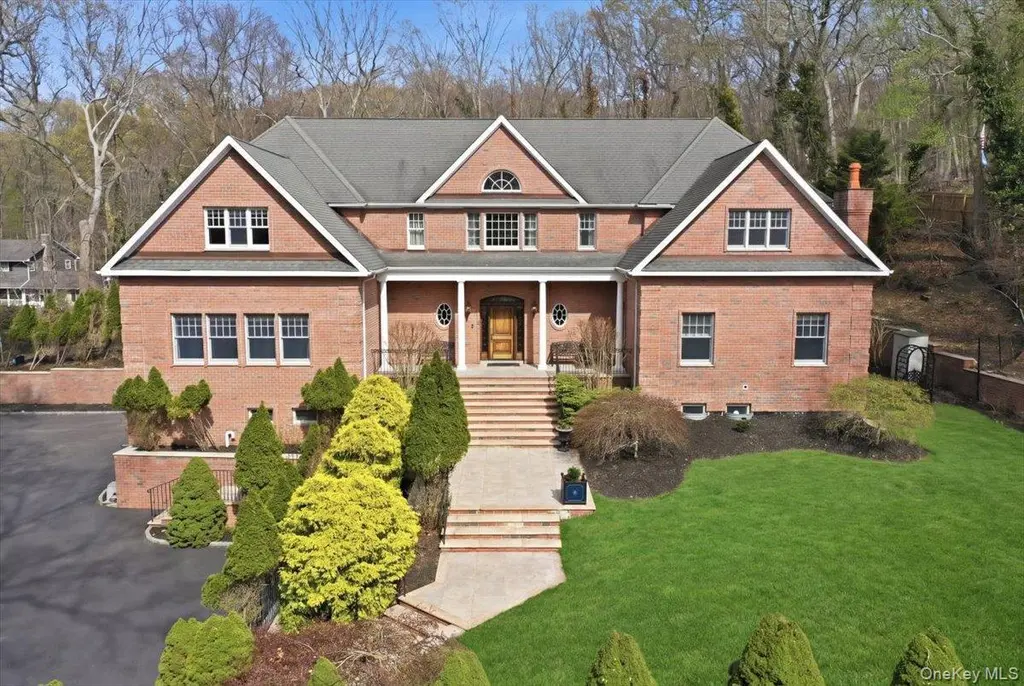
60 Harbor Rd
Head of the Harbor, NY 11780
$1,850,000F
5 bd · 2.5 ba ·
2,519 sqft ·
Built 2005
· SingleFamily
· Pending
· 11 DOM
Cashflow @ list (25.0% down · 7.5%)
Estimated rent
$4,379/mo
Mortgage (P&I)
−$9,702
Tax + insurance
−$3,442
HOA
−$0
Vac / Maint / Mgmt
−$920
Net cashflow
$-9,684/mo
Annual
$-116,206/yr
Cap rate
0.01%
Cash-on-cash
-22.43%
DSCR
0.00
1% rule
0.24%
Cash to close
$518,000
Investor read
- This is a 5-bed/2.5-bath single-family listed at $1.85M.
- At list price, monthly cash flow is $-10k ($-116k/yr) — negative.
- To cash-flow at today's rent, offer at most $501k (72.9% below list).
- To meet the 1% rule (rent ≥ 1% of price), the offer needs to be $438k (76.3% below list).
- Only 11 days on market — expect competitive offers; lowballing is unlikely to land.
- Recommended offer: $438k (76.3% below list) — sets the bar for 1% rule.
- Local home prices are declining (-3.0%/yr); year-one equity from $13k of loan paydown is wiped out by about $56k of value loss. Plan a longer hold.
- Location reads 64/100 on livability (#719 in NY) — a middle-class / working-renter tenant base. Strengths: crime A+, employment A+, housing A+; Watch: amenities F, commute F, cost of living F.
- Smithtown Central School District (suburban): math 71% / reading 70% proficiency, ranked #86 of 590 in NY (top 15%) — strong family-tenant draw, lease renewals of 3-5y typical; only 5% free/reduced lunch — higher-income household profile.
- Zoned schools: Saint James Elementary School (math 62% / reading 67%, grade B, #591 of 2,108 statewide, top 31%, 474 students, 15% FRL); Nesaquake Middle School (math 44% / reading 67%, grade B-, #211 of 729 statewide, top 29%, 473 students, 10% FRL); Smithtown High School East (math 96% / reading 82%, grade A+, #288 of 1,100 statewide, top 27%, 1,475 students, 12% FRL).
- Market conditions: 125 active listings in the ZIP; 2 comparable units currently listed for rent nearby; 1,366 units permitted in Suffolk County in 2024 (216 in 5+ unit buildings).
- Suffolk County population projected to shrink 5% by 2050 — rents likely to lag national; underwrite the cash flow, not the appreciation.
- 4 sale attempts since 12y ago with the ask held roughly flat each time — persistent listings suggest the price (not the market) is what's stuck; bring a comps-based counter.
- Current owner paid $1.40M; 32% above their basis — modest negotiation headroom, anchor on the comps not their cost.
- Climate carrying-cost: severe wind risk, 80% chance of damaging wind over 30y — expect insurance premiums to compound above CPI over the hold.
Questions for listing agent
- What do current leases actually rent for vs. the listed asking? Can we see a recent rent roll and the last 12 months of T-12 income?
- Is there a deadline driving the sale (1031 exchange, divorce, estate, relocation)? That informs how much negotiation room exists.
- Schools are B-rated — typically a magnet for longer-tenancy family renters. What's the average tenant stay here, and is there a school-zone premium baked into asking?
- The area grade is low — what's the realistic commute time and amenity access for the typical tenant pool here? Any planned neighborhood developments (good or bad) we should know about?
- What's the average days-on-market for RENTAL listings here right now (not sales)? A rising rental-DOM trend means longer vacancies and softer asking-rent achievability than the comps imply.
- What's the recent tenant-quality profile in this submarket — average credit score on applications, eviction rate, late-payment / NSF rate, and stable-employment percentage? A property-management company in the area should have these aggregated.
- How much new for-sale + rental construction is in the pipeline within 1–3 miles? Heavy new supply typically softens prices + rents 12–24 months out; constrained supply supports both.
CashFlowRE · CFR-E62E0Q8JH68VTV
· Data 4 weeks ago
cashflowre.app · 2026-05-29