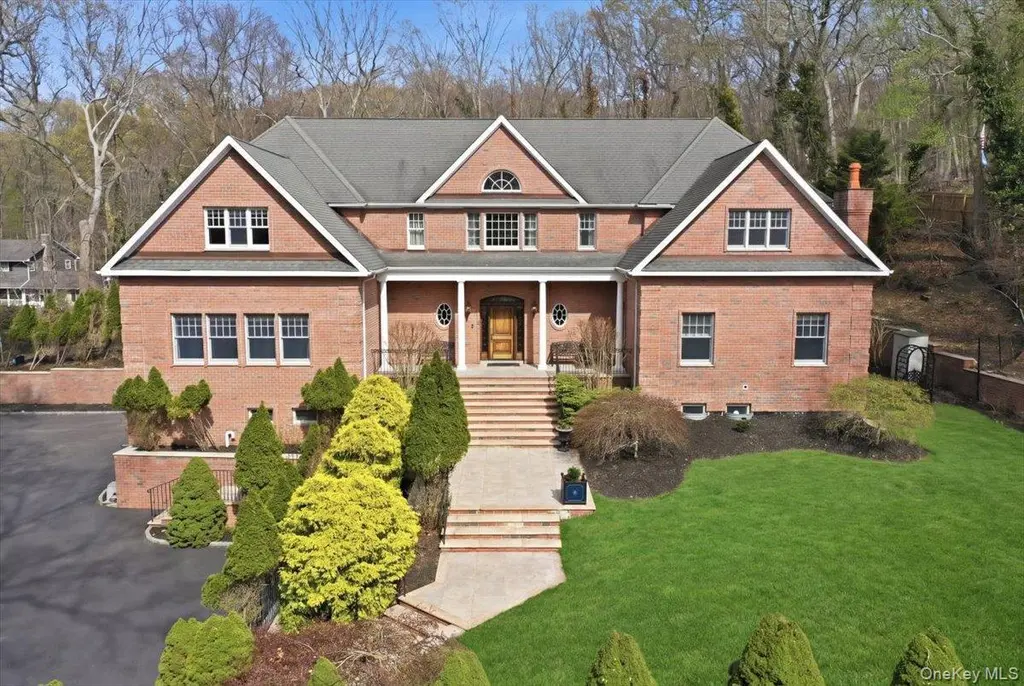
60 Harbor Rd · Head of the Harbor, NY
Flood risk 1/10 · Minimal
- FEMA flood zone
- X (unshaded)
- Chance of flooding over 30 yrs
- 0.0%
- Est. flood insurance / yr
- $473 – $860
Fire risk 4/10 · Minor
- Est. fire insurance / yr
- $691 – $1,283
Heat risk 4/10 · Minor
- Hot days now (above 95°F)
- 6 days/yr
- Hot days in 30 yrs
- 14 days/yr
Wind risk 8/10 · Major
- Chance of severe wind over 30 yrs
- 80.0%
Air-quality risk 4/10 · Minor
- Unhealthy air days now
- 3 days/yr
- Unhealthy air days in 30 yrs
- 5 days/yr
Risk factors via First Street. Map © Google.
Why this score? — see what drove the F grade
The composite is a weighted blend of 9 inputs, each scored 0–100. Each bar is that input's sub-score; the figure is the points it added to the 100-point composite (weight × sub-score).
- Schools +6.6/10.0
- Livability +3.2/5.0
- Rent growth +2.5/5.0
- Condition / age +2.5/5.0
- Cash flow +0.0/30.0
- 1% rule +0.0/10.0
- DSCR +0.0/10.0
- ARV discount +0.0/15.0
- Appreciation +0.0/10.0
$1,850,000
🖨 Deal sheet (PDF) 📄 Offer letter ✓ Due diligence
Listing remarks MLS
This 5800 Sf All Brick Designer Showplace Is Set Upon 2 Acres Across From Stony Brook Harbor. Winter Water Views Can Be Enjoyed Throughout This Beauty. Among Its Obvious Custom Design, You Will Find Attention To Detail At Every Turn. Come Inside And Experience Its 10Ft Ceilings, Mahogany Flrs, Gourmet Kit W/Granite Countertops, Arched Doorways, 1st Fl Master Suite Overlooking Igp And So Much More. Relax By The Fp, Entertain Both Inside & Out. Experience The Luxury That Awaits Within., Additional information: Appearance:Diamond+++,Separate Hotwater Heater:Y
Key facts
- Private acres
- Inground gunite pool
- Seasonal water views
Tags
Property features AI
Exterior
- Parking: Attached parking; Driveway; Private parking; Storage; 3-car garage
- Security: Smoke detectors; Other security features
- Utilities: Cesspool sewer; Cable available; Electricity connected; Propane; Water available and connected
- Home design: Single family residence; Three or more levels; Living area based on plans
- Construction: Brick construction
- Exterior features: Balcony; Patio; Porch; Gas grill; Outdoor kitchen; Lighting; Mailbox; Shed(s); Partial fencing; Back yard; Front yard; Garden; Landscaped grounds; Partially wooded; Sprinklers in front and rear; Stone/brick wall; Views; Private in-ground pool with diving board, electric heat, pool cover and tile
Interior
- Kitchen: Chef's kitchen with kitchen island; Granite and stone counters; Eat-in kitchen; Pantry; Dishwasher; Oven; Range; Refrigerator; Stainless steel appliances
- Bedrooms: Master bedroom located on the main level
- Flooring: Hardwood floors; Tile floors
- Bathrooms: Seven full bathrooms; One half bathroom
- Heating & cooling: Central air conditioning; Forced air heating; Oil heating; Radiant heating
- Interior features: First-floor bedroom and full bath; Built-in features; Central vacuum; Chandelier; Chef's kitchen; Crown molding; Double vanity; Eat-in kitchen; Entrance foyer; Formal dining room; Granite counters; High ceilings; Kitchen island; Natural woodwork; Open kitchen; Pantry; Primary bathroom; Master bedroom on main level; Stone counters; Storage; Tray ceilings; Walk-in closets
- Laundry & utility: Laundry room; Washer; Dryer; Central vacuum
Neighborhood map
What this means for you Summary
Snapshot
- This is a 5-bed/2.5-bath single-family listed at $1.85M.
Deal economics
- At list price, monthly cash flow is $-10k ($-116k/yr) — negative.
- To cash-flow at today's rent, offer at most $501k (72.9% below list).
- To meet the 1% rule (rent ≥ 1% of price), the offer needs to be $438k (76.3% below list).
- Recommended offer: $438k (76.3% below list) — sets the bar for 1% rule.
Location & tenants
- Location reads 64/100 on livability (#719 in NY) — a middle-class / working-renter tenant base. Strengths: crime A+, employment A+, housing A+; Watch: amenities F, commute F, cost of living F.
- Smithtown Central School District (suburban): math 71% / reading 70% proficiency, ranked #86 of 590 in NY (top 15%) — strong family-tenant draw, lease renewals of 3-5y typical; only 5% free/reduced lunch — higher-income household profile.
- Zoned schools: Saint James Elementary School (math 62% / reading 67%, grade B, #591 of 2,108 statewide, top 31%, 474 students, 15% FRL); Nesaquake Middle School (math 44% / reading 67%, grade B-, #211 of 729 statewide, top 29%, 473 students, 10% FRL); Smithtown High School East (math 96% / reading 82%, grade A+, #288 of 1,100 statewide, top 27%, 1,475 students, 12% FRL).
- Market conditions: 124 active listings in the ZIP; 2 comparable units currently listed for rent nearby; 1,366 units permitted in Suffolk County in 2024 (216 in 5+ unit buildings).
Forward outlook
- Local home prices are declining (-3.0%/yr); year-one equity from $13k of loan paydown is wiped out by about $56k of value loss. Plan a longer hold.
- Suffolk County population projected to shrink 5% by 2050 — rents likely to lag national; underwrite the cash flow, not the appreciation.
Negotiation context
- Only 11 days on market — expect competitive offers; lowballing is unlikely to land.
- 4 sale attempts since 12y ago with the ask held roughly flat each time — persistent listings suggest the price (not the market) is what's stuck; bring a comps-based counter.
- Current owner paid $1.40M; 32% above their basis — modest negotiation headroom, anchor on the comps not their cost.
Risks & watch-outs
- Climate carrying-cost: severe wind risk, 80% chance of damaging wind over 30y — expect insurance premiums to compound above CPI over the hold.
Questions for the listing agent
- What do current leases actually rent for vs. the listed asking? Can we see a recent rent roll and the last 12 months of T-12 income?
- Is there a deadline driving the sale (1031 exchange, divorce, estate, relocation)? That informs how much negotiation room exists.
- Schools are B-rated — typically a magnet for longer-tenancy family renters. What's the average tenant stay here, and is there a school-zone premium baked into asking?
- The area grade is low — what's the realistic commute time and amenity access for the typical tenant pool here? Any planned neighborhood developments (good or bad) we should know about?
- What's the average days-on-market for RENTAL listings here right now (not sales)? A rising rental-DOM trend means longer vacancies and softer asking-rent achievability than the comps imply.
- What's the recent tenant-quality profile in this submarket — average credit score on applications, eviction rate, late-payment / NSF rate, and stable-employment percentage? A property-management company in the area should have these aggregated.
- How much new for-sale + rental construction is in the pipeline within 1–3 miles? Heavy new supply typically softens prices + rents 12–24 months out; constrained supply supports both.
Investment metrics
- 1% rule
- 0.24% ✗
- Cap rate
- 0.01%
- Cash-on-cash
- -22.43%
- DSCR
- 0.00
- GRM
- 35.2
CMA / ARV
- ARV (on-the-fly)
- $1,282,171
- Comps found
- 2
Show comp detail 2 sales within ~0.75 mi
| Address | Dist | Beds/Ba | Sqft | Sold | Price | $/sf | Match |
|---|---|---|---|---|---|---|---|
| 12 Briarwood Ct | 0.69mi | 5/2.5 | 2,753 (+9%) | 2mo | $1,400,000 | $509 | 51 |
| 29 Three Sisters Rd | 0.61mi | 4/3.0 (-1) | 2,485 (-1%) | 22mo | $850,000 | $342 | 44 |
Match score weights: distance 35% · size 25% · config 20% · recency 20%. Top-matched comps best support the ARV.
Projected returns pro-forma
-3.0% appreciation · 3.0% rent growth · sell at horizon
- IRR
- -64.6%
- Equity multiple
- -0.77×
- Total profit
- $-916,261
- Equity at exit
- $275,841
- IRR
- —
- Equity multiple
- -2.07×
- Total profit
- $-1,590,889
- Equity at exit
- $159,954
Cash invested: $518,000 (down + closing). Projections, not guarantees.
Landlord ↔ Tenant lean methodology
- Overall (STATE)
- 15 Strongly Tenant-Friendly
- State New York
- 15 Strongly Tenant-Friendly · D+10
- County
- — inherits STATE
- City
- — inherits STATE
ZIP-level market 11780
- Active inventory
- 124
- Price-to-rent
- 35.2×
Monthly cashflow live
- Estimated rent
- $4,379 medium interval (Pro) →
- Mortgage (P&I)
- −$9,702
- Tax from tax record
- −$2,671 /mo · $32,052/yr
- Insurance
- −$771
- HOA
- −$0
- Vacancy / Maint / Mgmt
- −$920
- Net cashflow
- $-9,684
Break-even live
Sensitivity live
| Price | -10% $-8,637 | -5% $-9,160 | +0% $-9,684 | +5% $-10,207 | +10% $-10,731 |
|---|---|---|---|---|---|
| Rent | -10% $-10,030 | -5% $-9,857 | +0% $-9,684 | +5% $-9,511 | +10% $-9,338 |
| Rate | -1.0pp $-8,752 | -0.5pp $-9,213 | base $-9,684 | +0.5pp $-10,163 | +1.0pp $-10,651 |
UW: 25.0% down · 7.5% · 30yr · 1.5% tax · 5.0% vac · 8.0% maint · 8.0% mgmt
Financing live
Cash to close
- Down payment
- $462,500
- Closing costs
- $55,500
- Reserves months
- —
- Total cash needed
- —
Loan-product check · same deal, 3 products live
Conventional
25% down · 7.5% · 30yr
- Down + closing
- —
- Monthly P&I
- —
- Monthly cashflow
- —
- DSCR
- —
- Eligible?
- —
Personal DTI + credit; lowest rate.
DSCR
20% down · 8.5% · 30yr
- Down + closing
- —
- Monthly P&I
- —
- Monthly cashflow
- —
- DSCR
- —
- Eligible?
- —
No personal income docs; deal must DSCR.
Hard money
10% down · 12.0% · 12mo
- Down + closing
- —
- Monthly P&I
- —
- Monthly cashflow
- —
- DSCR
- —
- Eligible?
- —
Short-term bridge; refi at stabilization.
Rent comps 2 comps
| Address | Beds | Baths | Sqft | Rent | $/sqft | DOM | Units | Dist |
|---|---|---|---|---|---|---|---|---|
| 496 Route 25A Saint James, NY | 5.0 | 3.0 | 2600 | $4,500 | $1.73 | 0d | 1 | 0.97mi |
| 445 N Country Rd St James, NY | 4.0 | 2.0 | 3000 | $4,200 | $1.40 | 19d | 1 | 1.24mi |
Listing history 14 events
-
2026-04-28status Pending
-
2026-04-17$1,850,000 Active
-
2019-08-28soldstatus $1,400,000
-
2019-08-01soldstatus $1,400,000 Closed 568-char remark
Show marketing remark (568 chars)
This 5800 Sf All Brick Designer Showplace Is Set Upon 2 Acres Across From Stony Brook Harbor. Winter Water Views Can Be Enjoyed Throughout This Beauty. Among Its Obvious Custom Design, You Will Find Attention To Detail At Every Turn. Come Inside And Experience Its 10Ft Ceilings, Mahogany Flrs, Gourmet Kit W/Granite Countertops, Arched Doorways, 1st Fl Master Suite Overlooking Igp And So Much More. Relax By The Fp, Entertain Both Inside & Out. Experience The Luxury That Awaits Within., Additional information: Appearance:Diamond+++,Separate Hotwater Heater:Y
-
2019-04-13status Under Contract 568-char remark
Show marketing remark (568 chars)
This 5800 Sf All Brick Designer Showplace Is Set Upon 2 Acres Across From Stony Brook Harbor. Winter Water Views Can Be Enjoyed Throughout This Beauty. Among Its Obvious Custom Design, You Will Find Attention To Detail At Every Turn. Come Inside And Experience Its 10Ft Ceilings, Mahogany Flrs, Gourmet Kit W/Granite Countertops, Arched Doorways, 1st Fl Master Suite Overlooking Igp And So Much More. Relax By The Fp, Entertain Both Inside & Out. Experience The Luxury That Awaits Within., Additional information: Appearance:Diamond+++,Separate Hotwater Heater:Y
-
2019-03-04$1,400,000 New 568-char remark
Show marketing remark (568 chars)
This 5800 Sf All Brick Designer Showplace Is Set Upon 2 Acres Across From Stony Brook Harbor. Winter Water Views Can Be Enjoyed Throughout This Beauty. Among Its Obvious Custom Design, You Will Find Attention To Detail At Every Turn. Come Inside And Experience Its 10Ft Ceilings, Mahogany Flrs, Gourmet Kit W/Granite Countertops, Arched Doorways, 1st Fl Master Suite Overlooking Igp And So Much More. Relax By The Fp, Entertain Both Inside & Out. Experience The Luxury That Awaits Within., Additional information: Appearance:Diamond+++,Separate Hotwater Heater:Y
-
2019-01-05historical
-
2018-09-24price $1,499,990
-
2018-09-02price $1,575,000
-
2018-06-24price $1,599,000
-
2018-04-18$1,699,000 New
-
2014-12-29historical
-
2014-01-02$1,749,000
-
2003-06-10soldstatus $795,000
ⓘ Source: listings_history table (triggers on properties + properties_extension) + one-shot
backfill from property_details.listing_events for pre-trigger history.
Tax reassessment forecast NY · Partial reset (capped growth)
- Current annual tax
- $32,052 · $2,671/mo
- Projected year-2 tax
- $32,052 · $2,671/mo
- Expected delta
- $0/yr ($0/mo · 0.0%)
ⓘ Screening estimate from a state-policy table — verify with the county assessor before closing.
Climate risk First Street
- Flood 1/10 Low FEMA zone X (unshaded) · 0% chance over 30 yrs
- Wildfire 4/10 Moderate
- Heat 4/10 Moderate 6 d/yr ≥95°F today · 14 d/yr by 30 yrs out
- Wind 8/10 Severe 80% chance of damaging wind over 30 yrs
- Air quality 4/10 Moderate 3 unhealthy d/yr today · 5 by 30 yrs out
Nearby sold comps map
Loading sold comps map…
Walkable amenities ~0.75 mi
Loading nearby amenities…
Taxation est. · year 1
- Rental income
- $52,551
- − Mortgage interest
- −$103,629
- − Property taxes
- −$32,052
- − Insurance
- −$9,250
- − Repairs & maintenance
- −$4,204
- − Management
- −$4,204
- − Depreciation
- −$53,818
- Taxable loss
- −$154,606
- Est. tax savings @ 24.0%
- +$37,105
- After-tax cash flow
- $-79,101/yr
For passive investors: Depreciation is non-cash, so a rental often shows a tax loss while cash-flowing — sheltering income. Rental losses are passive: they offset passive income freely, and up to $25,000/yr can offset ordinary (W-2) income if you actively participate and your MAGI is under $100k (phasing out to $0 by $150k); unused losses carry forward. On sale, claimed depreciation is recaptured at up to 25%, and gains may owe capital-gains tax (a 1031 exchange can defer both). Figures are a year-1 estimate at your 24.0% rate — not tax advice; consult a CPA.
Schools (NCES district)
- District
- Smithtown Central School District
- NCES district ID
- 3627060
- Math proficiency
- 71% ▼ -6.00%
- Reading proficiency
- 70% ▼ -1.00%
- Median HH income
- $110,009
- Composite
- 65.53/100
- National rank
- #473
- State rank
- #86 of 590 in NY
Livability — Head of the Harbor
- Score
- 64/100
- State rank
- #719
- US rank
- #13626
Category grades
Schools grade is shown separately in the Schools card above.
Census & demographics
- Census place
- Head of the Harbor, NY
- Population (ZIP)
- 15,586
Population outlook (Suffolk County) Hauer SSP2
- Today (2025)
- 1,505,262 people
- By 2030
- 1,498,318 · -0.5%
- By 2040
- 1,471,101 · -2.3%
- By 2050
- 1,424,848 · -5.3%
- By 2075
- 1,337,157 · -11.2%
- By 2100
- 1,217,720 · -19.1%
Race, ethnicity, and origin ACS 2023
- Neighborhood character
- Predominantly White (81%)
- Race & ethnicity
- White 81% Hispanic / Latino 11% Two or more races 7% Asian 5%
- Hispanic origin (detail)
- Puerto Rican 2%
- Common ancestry
- Romanian 5% Scotch-Irish 3% Italian 1%
- Foreign-born
- 9% · Canada, China, Jamaica
- Languages at home
- 89% English-only · Spanish 7% Chinese 1% Other Indo-European 1%
Political lean MEDSL · Suffolk
- 2024 margin
- Lean R (+10.0) · D 45.0% · R 55.0%
- 2008→2024 swing
- -16.0pp toward R · 2008: 6.0pp · 2024: -10.0pp
- All cycles
- 2024: R+10.0 2020: R+0.0 2016: R+8.2 2012: D+2.9 2008: D+6.0
Not yet ingested
- Civics
- —
Market trends
- HPI YoY
- ▼ -610.91%
- Current HPI
- 290.2363
- Rent YoY
- —
- Metro
- —
- State GDP YoY
- ▲ 2.60%
- F500 in state
- 92
Industry mix (Fortune 500 HQ in NY)
| Industry | F500 HQs | Revenue |
|---|---|---|
| Financial Services | 10 | $950B |
|
||
| Consumer Goods | 9 | $162B |
|
||
| Insurance | 4 | $225B |
|
||
| Telecommunications | 2 | $144B |
|
||
| Pharmaceuticals | 2 | $112B |
|
||
| Media / Entertainment | 2 | $69B |
|
||
Price history
+132.7% since first listed14 events — show timeline
- 2026-04-28 Pending — OneKey® MLS as Distributed by MLS Grid
- 2026-04-17 Listed $1,850,000 OneKey® MLS as Distributed by MLS Grid
- 2019-08-28 Sold (Public Records) $1,400,000 Public Records
- 2019-08-01 Sold (MLS) $1,400,000 OneKey® MLS as Distributed by MLS Grid
- 2019-04-13 Pending — OneKey® MLS as Distributed by MLS Grid
- 2019-03-04 Listed $1,400,000 OneKey® MLS as Distributed by MLS Grid
- 2019-01-05 Listing Removed — OneKey® MLS as Distributed by MLS Grid
- 2018-09-24 Price Changed $1,499,990 OneKey® MLS as Distributed by MLS Grid
- 2018-09-02 Price Changed $1,575,000 OneKey® MLS as Distributed by MLS Grid
- 2018-06-24 Price Changed $1,599,000 OneKey® MLS as Distributed by MLS Grid
- 2018-04-18 Listed $1,699,000 OneKey® MLS as Distributed by MLS Grid
- 2014-12-29 Listing Removed — OneKey® MLS as Distributed by MLS Grid
- 2014-01-02 Listed $1,749,000 OneKey® MLS as Distributed by MLS Grid
- 2003-06-10 Sold (Public Records) $795,000 Public Records
Property tax history
+0.7%/yrLatest (2025): $32,052 · -8.9% YoY. Source: county tax records.
Cash-flow waterfall
monthlySold comps — $/sqft
last 12 mo · ≤1 miLoading sold comps…