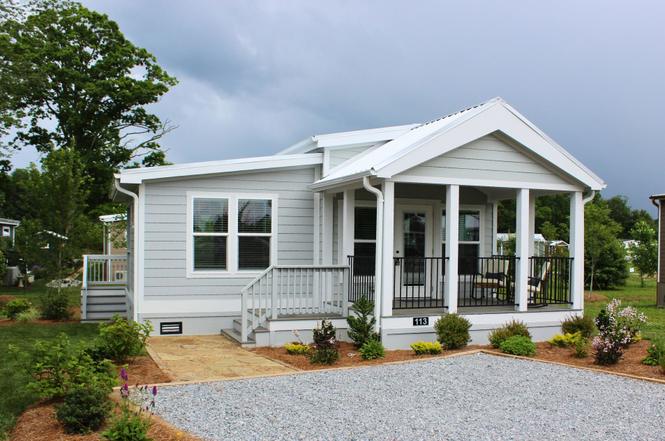
Cumberland - 2 Bedrooms Plan
Dana, NC 28731
$207,100D
2 bd · 1.0 ba ·
540 sqft ·
Built —
· SingleFamily
· Active
· 571 DOM
Cashflow @ list (25.0% down · 7.5%)
Estimated rent
$1,900/mo
Mortgage (P&I)
−$1,086
Tax + insurance
−$345
HOA
−$0
Vac / Maint / Mgmt
−$399
Net cashflow
$69/mo
Annual
$833/yr
Cap rate
6.69%
Cash-on-cash
1.44%
DSCR
1.06
1% rule
0.92%
Cash to close
$57,988
Investor read
- This is a 2-bed/1.0-bath single-family listed at $207k.
- At list price, monthly cash flow is $69 ($833/yr) — positive.
- The deal already cash-flows at list — no discount required.
- To meet the 1% rule (rent ≥ 1% of price), the offer needs to be $190k (8.3% below list).
- It's been on market 571 days — a 12% lower offer ($182k) is reasonable based on typical stale-listing flexibility.
- Recommended offer: $182k (12.0% below list) — sets the bar for market timing.
- Local home prices are declining (-3.0%/yr); year-one equity from $1k of loan paydown is wiped out by about $6k of value loss. Plan a longer hold.
- Location reads 60/100 on livability (#511 in NC) — a middle-class / working-renter tenant base. Strengths: cost of living A+, housing A+, crime A-; Watch: employment D, amenities F, commute F.
- Henderson County Schools (suburban): math 48% / reading 52% proficiency, ranked #64 of 178 in NC (top 36%) — acceptable for families but not a draw, mixed tenant base, ~2y average lease.
- Zoned schools: Upward Elementary (math 31% / reading 28%, grade F, #975 of 1,410 statewide, top 71%, 413 students, 83% FRL); Flat Rock Middle (math 36% / reading 44%, grade F, #222 of 475 statewide, top 49%, 706 students, 70% FRL); East Henderson High (math 62% / reading 63%, grade B-, #179 of 535 statewide, top 34%, 965 students, 61% FRL) — zoned schools average 71% FRL vs 46% district-wide (25 pts higher); higher-poverty schools than district average — tighter screening recommended.
- Market conditions: 177 active listings in the ZIP; 1 comparable units currently listed for rent nearby; 1,534 units permitted in Henderson County in 2024 (558 in 5+ unit buildings).
- Henderson County population projected at +20% by 2050 — long-run rental-demand tailwind backs the buy-and-hold thesis.
- Cap rate 6.7% vs local median 3.2% in Dana — top-decile yield for the area; either an underpriced asset or a hidden risk that comps aren't pricing in. Stress-test before assuming the spread holds.
Questions for listing agent
- It's been on market 571 days. Have you received any prior offers? Is the seller open to a 12% concession, seller financing, or rate buy-down credit?
- Why hasn't it sold? Are there any deal-killer items the seller is aware of (foundation, flood, title, zoning, code violations)?
- Is there a deadline driving the sale (1031 exchange, divorce, estate, relocation)? That informs how much negotiation room exists.
- Schools are F-rated, which usually means shorter tenancies and higher turnover. Who's the typical renter profile here, and what's been the actual vacancy rate?
- The area grade is low — what's the realistic commute time and amenity access for the typical tenant pool here? Any planned neighborhood developments (good or bad) we should know about?
- What's the average days-on-market for RENTAL listings here right now (not sales)? A rising rental-DOM trend means longer vacancies and softer asking-rent achievability than the comps imply.
- What's the recent tenant-quality profile in this submarket — average credit score on applications, eviction rate, late-payment / NSF rate, and stable-employment percentage? A property-management company in the area should have these aggregated.
- How much new for-sale + rental construction is in the pipeline within 1–3 miles? Heavy new supply typically softens prices + rents 12–24 months out; constrained supply supports both.
CashFlowRE · CFR-E71TH806W7BA47
· Data 19 h ago
cashflowre.app · 2026-05-29