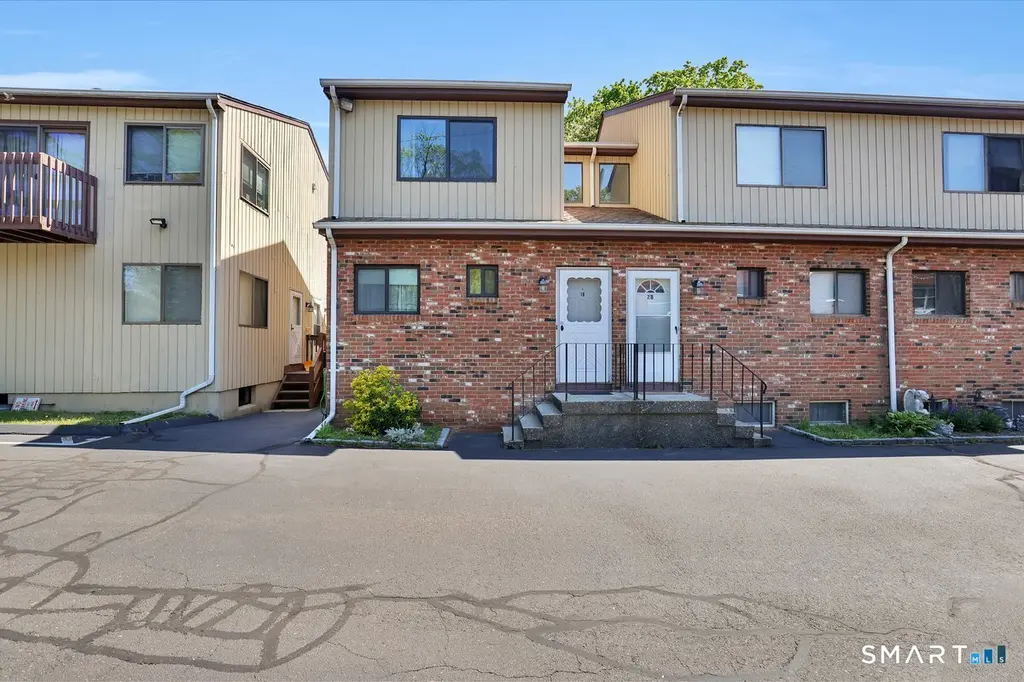
60 Wolfpit Ave Unit 1B
Norwalk, CT 06851
$329,000D
2 bd · 1.5 ba ·
1,056 sqft ·
Built 1984
· Condo
· Under Contract
· 4 DOM
Cashflow @ list (25.0% down · 7.5%)
Estimated rent
$3,102/mo
Mortgage (P&I)
−$1,725
Tax + insurance
−$469
HOA
−$317
Vac / Maint / Mgmt
−$651
Net cashflow
$-61/mo
Annual
$-731/yr
Cap rate
6.07%
Cash-on-cash
-0.79%
DSCR
0.96
1% rule
0.94%
Cash to close
$92,120
Investor read
- This is a 2-bed/1.5-bath condo listed at $329k.
- At list price, monthly cash flow is $-61 ($-731/yr) — negative.
- To cash-flow at today's rent, offer at most $318k (3.3% below list).
- To meet the 1% rule (rent ≥ 1% of price), the offer needs to be $310k (5.7% below list).
- Only 4 days on market — expect competitive offers; lowballing is unlikely to land.
- Recommended offer: $310k (5.7% below list) — sets the bar for 1% rule.
- Local home prices are declining (-3.0%/yr); year-one equity from $2k of loan paydown is wiped out by about $10k of value loss. Plan a longer hold.
- Location reads 77/100 on livability (#41 in CT, #2,966 nationally) — a middle-class / working-renter tenant base. Strengths: employment A+, health & safety A+, crime A; Watch: amenities C-, cost of living F.
- Norwalk School District (urban): math 29% / reading 44% proficiency, ranked #104 of 153 in CT (top 68%) — families likely to look elsewhere, expect single-tenant / working-renter base with shorter leases.
- Market conditions: Rents rising (+2.1%/yr); 94 active listings in the ZIP; 37 comparable units currently listed for rent nearby; rentals at typical pace (median 25d on market — plan ~3-4 weeks tenant-placement turnaround); high-income renter base; 1,151 units permitted in Western Connecticut Planning Region in 2024 (714 in 5+ unit buildings).
- Current owner paid $118k; list at $329k implies a 179% gain — meaningful room to come down on a strong offer.
- Cap rate 6.1% vs local median 3.4% in Norwalk — top-decile yield for the area; either an underpriced asset or a hidden risk that comps aren't pricing in. Stress-test before assuming the spread holds.
- This rent runs 33% of the median local income ($111k/yr) — at the standard rent-burdened threshold; future hikes will face affordability resistance.
Questions for listing agent
- What do current leases actually rent for vs. the listed asking? Can we see a recent rent roll and the last 12 months of T-12 income?
- What does the HOA fee cover, when was the last increase, and are there any pending special assessments or reserve-fund shortfalls?
- Any open or pending special assessments — roof, HVAC, plumbing, elevator, façade? What's the per-unit balance and payoff schedule, and is the seller paying it off at close or rolling it to the buyer?
- Is there a deadline driving the sale (1031 exchange, divorce, estate, relocation)? That informs how much negotiation room exists.
- The area grade is low — what's the realistic commute time and amenity access for the typical tenant pool here? Any planned neighborhood developments (good or bad) we should know about?
- What's the average days-on-market for RENTAL listings here right now (not sales)? A rising rental-DOM trend means longer vacancies and softer asking-rent achievability than the comps imply.
- What's the recent tenant-quality profile in this submarket — average credit score on applications, eviction rate, late-payment / NSF rate, and stable-employment percentage? A property-management company in the area should have these aggregated.
- How much new apartment / multifamily construction is in the pipeline within 1–3 miles? Heavy new supply (>2% of stock underway) typically softens rents 12–24 months out; light construction supports rent growth.
CashFlowRE · CFR-E7Q59JE7EMB2Q8
· Data 3 weeks ago
cashflowre.app · 2026-05-29