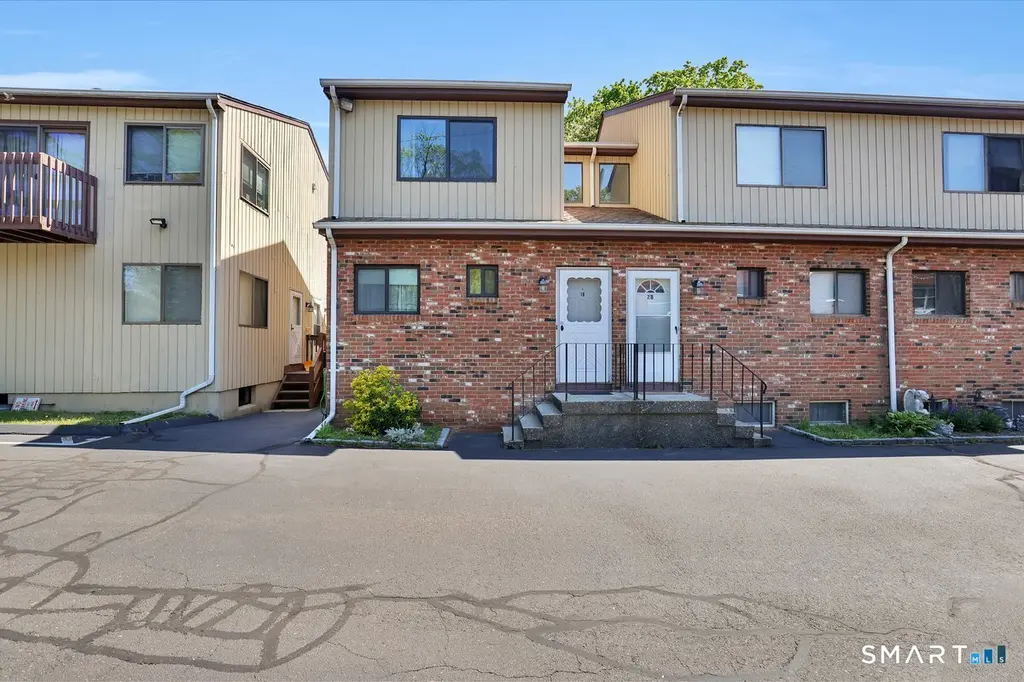
60 Wolfpit Ave Unit 1B · Norwalk, CT
Flood risk No data
- FEMA flood zone
- —
- Chance of flooding over 30 yrs
- —
- Est. flood insurance / yr
- —
Fire risk No data
- Est. fire insurance / yr
- —
Heat risk No data
- Hot days now (above threshold)
- —
- Hot days in 30 yrs
- —
Wind risk No data
- Chance of severe wind over 30 yrs
- —
Air-quality risk No data
- Unhealthy air days now
- —
- Unhealthy air days in 30 yrs
- —
Risk factors via First Street. Map © Google.
Why this score? — see what drove the D grade
The composite is a weighted blend of 9 inputs, each scored 0–100. Each bar is that input's sub-score; the figure is the points it added to the 100-point composite (weight × sub-score).
- Cash flow +12.3/30.0
- ARV discount +7.5/15.0
- 1% rule +4.4/10.0
- Livability +3.9/5.0
- DSCR +3.6/10.0
- Schools +3.4/10.0
- Rent growth +3.0/5.0
- Condition / age +2.5/5.0
- Appreciation +0.0/10.0
$329,000
🖨 Deal sheet (PDF) 📄 Offer letter ✓ Due diligence
Listing remarks
Welcome to Wolfpit II condo's, unit number 1B! This three story condo offers a functional layout perfect for today's living. The main level features a kitchen upgraded with manufactured stone countertops, lots of cabinetry, matching stove, refrigerator and dishwasher, large living room, dining area and half bath. There is a combination of hardwood and carpeted floors. Upstairs are two good sized bedrooms with lots of closet space. There second floor also has a shared full bath. The basement has a large finished area that gives you extra room. The laundry is also in the full basement for your convenience. There is additional storage space next to the rec room. There are two parking spaces #5
Key facts
- Lots of cabinetry
- Dining area
- Large living room
Tags
Property features AI
Finance
- Other: Pets allowed; Part of an 11-unit building
- HOA & community: Homeowners association with monthly fee; HOA fee covers grounds maintenance, trash pickup, snow removal, water, sewer and insurance
Exterior
- Parking: Assigned parking; 2 parking spaces (spots 5 and 11 referenced in directions)
- Utilities: Public water; Public sewer; Electric service
- Home design: Condominium (Condo/Co-Op For Sale)
- Construction: Frame construction; Brick and beige exterior color
- Exterior features: Brick and wood siding
Interior
- Kitchen: Electric range; Refrigerator; Dishwasher
- Bedrooms: 2 bedrooms
- Bathrooms: 1 full bath; 1 half bath
- Heating & cooling: Electric hot air heat; Central air conditioning
- Interior features: 3 levels in unit; Full basement; Attic with hatch access; Central air
- Laundry & utility: Washer and dryer in unit (basement laundry); 50-gallon electric hot water tank
Neighborhood map
What this means for you Summary
Snapshot
- This is a 2-bed/1.5-bath condo listed at $329k.
Deal economics
- At list price, monthly cash flow is $-61 ($-731/yr) — negative.
- To cash-flow at today's rent, offer at most $318k (3.3% below list).
- To meet the 1% rule (rent ≥ 1% of price), the offer needs to be $310k (5.7% below list).
- Recommended offer: $310k (5.7% below list) — sets the bar for 1% rule.
- Cap rate 6.1% vs local median 3.4% in Norwalk — top-decile yield for the area; either an underpriced asset or a hidden risk that comps aren't pricing in. Stress-test before assuming the spread holds.
Location & tenants
- Location reads 77/100 on livability (#41 in CT, #2,966 nationally) — a middle-class / working-renter tenant base. Strengths: employment A+, health & safety A+, crime A; Watch: amenities C-, cost of living F.
- Norwalk School District (urban): math 29% / reading 44% proficiency, ranked #104 of 153 in CT (top 68%) — families likely to look elsewhere, expect single-tenant / working-renter base with shorter leases.
- Market conditions: Rents rising (+2.1%/yr); 94 active listings in the ZIP; 37 comparable units currently listed for rent nearby; rentals at typical pace (median 25d on market — plan ~3-4 weeks tenant-placement turnaround); high-income renter base; 1,151 units permitted in Western Connecticut Planning Region in 2024 (714 in 5+ unit buildings).
- This rent runs 33% of the median local income ($111k/yr) — at the standard rent-burdened threshold; future hikes will face affordability resistance.
Forward outlook
- Local home prices are declining (-3.0%/yr); year-one equity from $2k of loan paydown is wiped out by about $10k of value loss. Plan a longer hold.
Negotiation context
- Only 4 days on market — expect competitive offers; lowballing is unlikely to land.
- Current owner paid $118k; list at $329k implies a 179% gain — meaningful room to come down on a strong offer.
Questions for the listing agent
- What do current leases actually rent for vs. the listed asking? Can we see a recent rent roll and the last 12 months of T-12 income?
- What does the HOA fee cover, when was the last increase, and are there any pending special assessments or reserve-fund shortfalls?
- Any open or pending special assessments — roof, HVAC, plumbing, elevator, façade? What's the per-unit balance and payoff schedule, and is the seller paying it off at close or rolling it to the buyer?
- Is there a deadline driving the sale (1031 exchange, divorce, estate, relocation)? That informs how much negotiation room exists.
- The area grade is low — what's the realistic commute time and amenity access for the typical tenant pool here? Any planned neighborhood developments (good or bad) we should know about?
- What's the average days-on-market for RENTAL listings here right now (not sales)? A rising rental-DOM trend means longer vacancies and softer asking-rent achievability than the comps imply.
- What's the recent tenant-quality profile in this submarket — average credit score on applications, eviction rate, late-payment / NSF rate, and stable-employment percentage? A property-management company in the area should have these aggregated.
- How much new apartment / multifamily construction is in the pipeline within 1–3 miles? Heavy new supply (>2% of stock underway) typically softens rents 12–24 months out; light construction supports rent growth.
Investment metrics
- 1% rule
- 0.94% ✗
- Cap rate
- 6.07%
- Cash-on-cash
- -0.79%
- DSCR
- 0.96
- GRM
- 8.8
CMA / ARV
No comps found within radius.
Projected returns pro-forma
-3.0% appreciation · 2.11% rent growth · sell at horizon
- IRR
- -18.6%
- Equity multiple
- 0.35×
- Total profit
- $-59,751
- Equity at exit
- $49,055
- IRR
- -13.0%
- Equity multiple
- 0.27×
- Total profit
- $-67,339
- Equity at exit
- $28,446
Cash invested: $92,120 (down + closing). Projections, not guarantees.
Landlord ↔ Tenant lean methodology
- Overall (STATE)
- 27 Tenant-Leaning
- State Connecticut
- 27 Tenant-Leaning · D+7
- County
- — inherits STATE
- City
- — inherits STATE
ZIP-level market 06851
- Rents YoY
- 2.1%
- Active inventory
- 94
- Price-to-rent
- 8.8×
Monthly cashflow live
- Estimated rent
- $3,102 high interval (Pro) →
- Mortgage (P&I)
- −$1,725
- Tax from tax record
- −$332 /mo · $3,985/yr
- Insurance
- −$137
- HOA
- −$317
- Vacancy / Maint / Mgmt
- −$651
- Net cashflow
- $-61
Break-even live
Sensitivity live
| Price | -10% $125 | -5% $32 | +0% $-61 | +5% $-154 | +10% $-247 |
|---|---|---|---|---|---|
| Rent | -10% $-306 | -5% $-183 | +0% $-61 | +5% $62 | +10% $184 |
| Rate | -1.0pp $105 | -0.5pp $23 | base $-61 | +0.5pp $-146 | +1.0pp $-233 |
UW: 25.0% down · 7.5% · 30yr · 1.5% tax · 5.0% vac · 8.0% maint · 8.0% mgmt
Financing live
Cash to close
- Down payment
- $82,250
- Closing costs
- $9,870
- Reserves months
- —
- Total cash needed
- —
Loan-product check · same deal, 3 products live
Conventional
25% down · 7.5% · 30yr
- Down + closing
- —
- Monthly P&I
- —
- Monthly cashflow
- —
- DSCR
- —
- Eligible?
- —
Personal DTI + credit; lowest rate.
DSCR
20% down · 8.5% · 30yr
- Down + closing
- —
- Monthly P&I
- —
- Monthly cashflow
- —
- DSCR
- —
- Eligible?
- —
No personal income docs; deal must DSCR.
Hard money
10% down · 12.0% · 12mo
- Down + closing
- —
- Monthly P&I
- —
- Monthly cashflow
- —
- DSCR
- —
- Eligible?
- —
Short-term bridge; refi at stabilization.
Rent comps 37 comps
| Address | Beds | Baths | Sqft | Rent | $/sqft | DOM | Units | Dist |
|---|---|---|---|---|---|---|---|---|
| 41 Wolfpit Ave Norwalk, CT | 2.0 | 1.0 | 1100 | $2,650 | $2.41 | 11d | 2 | 0.13mi |
| 10 Willard Rd Norwalk, CT | 1.0–2.0 | 1.0–2.0 | 1048 | $4,326 | $4.13 | 4d | 37 | 0.17mi |
| 291 Strawberry Hill Ave Norwalk, CT | 1.0 | 1.0 | 1000 | $2,400 | $2.40 | 15d | 1 | 0.18mi |
| 42 County St Norwalk, CT | 2.0 | 2.0 | 910 | $3,680 | $4.04 | 22d | 1 | 0.22mi |
| 42 County St Norwalk, CT | 2.0 | 2.0 | 910 | $3,680 | $4.04 | 45d | 1 | 0.22mi |
| 193 Westport Ave Unit 3 Norwalk, CT | 1.0 | 1.0 | 800 | $1,950 | $2.44 | 13d | 1 | 0.42mi |
| 2 Margaret St Norwalk, CT | 2.0 | 1.0 | 1351 | $4,000 | $2.96 | 4d | 1 | 0.43mi |
| 60 Walter Ave Norwalk, CT | 3.0 | 1.5 | 1320 | $4,000 | $3.03 | 45d | 1 | 0.56mi |
| 33 Strathmore Ln #33 Westport, CT | 2.0 | 2.5 | 1440 | $4,100 | $2.85 | 15d | 1 | 0.58mi |
| 8 Norden Pl Norwalk, CT | 1.0–2.0 | 1.0–2.0 | 1010 | $3,786 | $3.75 | 3d | 11 | 0.92mi |
| 33 Macintosh Rd Norwalk, CT | 3.0 | 1.0 | 1044 | $3,500 | $3.35 | 4d | 1 | 0.95mi |
| 7 W Rocks Rd Norwalk, CT | 2.0 | 2.0 | 1274 | $4,000 | $3.14 | 4d | 1 | 1.02mi |
| 9 Park St Unit 2R Norwalk, CT | 1.0 | 1.0 | 768 | $2,100 | $2.73 | 24d | 1 | 1.02mi |
| 99 East Ave Rm 600 Norwalk, CT | 1.0 | 1.0 | 750 | $5,500 | $7.33 | 45d | 1 | 1.05mi |
| 10 Norden Pl Unit 245 Norwalk, CT | 2.0 | 2.0 | 1085 | $2,699 | $2.49 | 45d | 1 | 1.05mi |
| 10 Norden Pl Unit 207 Norwalk, CT | 2.0 | 2.0 | 1085 | $2,625 | $2.42 | 24d | 1 | 1.07mi |
| 93 East Ave Norwalk, CT | 1.0 | 1.0 | 760 | $6,500 | $8.55 | 45d | 1 | 1.08mi |
| 1 Smith St Norwalk, CT | 2.0 | 2.0 | 1107 | $3,350 | $3.03 | 45d | 1 | 1.16mi |
| 303 Newtown Ave Norwalk, CT | 3.0 | 1.0 | 1400 | $2,800 | $2.00 | 45d | 1 | 1.17mi |
| 7 Eclipse Ave Unit B Norwalk, CT | 2.0 | 1.0 | 825 | $2,550 | $3.09 | 45d | 1 | 1.17mi |
| 10 Norden Pl Unit 258 Norwalk, CT | 1.0 | 1.0 | 800 | $2,159 | $2.70 | 45d | 1 | 1.19mi |
| 10 Norden Pl Unit 288 Norwalk, CT | 2.0 | 2.0 | 1085 | $2,637 | $2.43 | 15d | 1 | 1.19mi |
| 10 Norden Pl Unit 307 Norwalk, CT | 2.0 | 2.0 | 1085 | $2,650 | $2.44 | 4d | 1 | 1.19mi |
| 10 Norden Pl Unit 242 Norwalk, CT | 1.0 | 1.0 | 800 | $2,033 | $2.54 | 24d | 1 | 1.19mi |
| 4 Daskams Ln #309 Norwalk, CT | 2.0 | 2.0 | 1344 | $3,200 | $2.38 | 15d | 1 | 1.26mi |
| 5 Isaacs St Unit 3A Norwalk, CT | 2.0 | 2.0 | 1050 | $2,495 | $2.38 | 15d | 1 | 1.27mi |
| 19 Isaacs St #208 Norwalk, CT | 2.0 | 2.0 | 876 | $3,250 | $3.71 | 45d | 1 | 1.30mi |
| 253 Riverside Ave Unit 202 Westport, CT | 2.0 | 3.0 | 1200 | $11,500 | $9.58 | 24d | 1 | 1.31mi |
| 253 Riverside Ave Unit 101 Westport, CT | 2.0 | 3.0 | 1300 | $10,500 | $8.08 | 24d | 1 | 1.31mi |
| 61 Wall St Norwalk, CT | 1.0–2.0 | 1.0 | 925 | $3,035 | $3.28 | 24d | 1 | 1.31mi |
| 251 Riverside Ave Unit 251A Westport, CT | 2.0 | 2.5 | 1420 | $12,000 | $8.45 | 24d | 1 | 1.31mi |
| 42 Center Ave Norwalk, CT | 2.0 | 1.0 | 1210 | $2,500 | $2.07 | 45d | 1 | 1.35mi |
| 4 River View Rd Westport, CT | 3.0 | 2.0 | 1258 | $7,200 | $5.72 | 45d | 1 | 1.41mi |
| 158 East Ave Unit 2 Norwalk, CT | 2.0 | 1.0 | 1188 | $2,300 | $1.94 | 45d | 1 | 1.42mi |
| 26 Belden Ave Norwalk, CT | 1.0–3.0 | 1.0–2.0 | 1135 | $3,407 | $3.00 | 4d | 20 | 1.43mi |
| 45 Wilton Ave Unit 1 Norwalk, CT | 3.0 | 1.0 | 1220 | $2,950 | $2.42 | 24d | 1 | 1.49mi |
| 66 Wilton Ave Unit 9 Norwalk, CT | 1.0 | 1.0 | 800 | $1,995 | $2.49 | 45d | 1 | 1.50mi |
HOA detail condo
- Monthly dues
- $317 · $3,804/yr
- Assessments
- None detected in remarks — confirm with the listing agent.
Listing history 3 events
-
2026-05-13status Under Contract
-
2026-05-09$329,000 Active
-
1999-06-30soldstatus $118,000
ⓘ Source: listings_history table (triggers on properties + properties_extension) + one-shot
backfill from property_details.listing_events for pre-trigger history.
Tax reassessment forecast CT · Partial reset (capped growth)
- Current annual tax
- $3,985 · $332/mo
- Projected year-2 tax
- $5,513 · $459/mo
- Expected delta
- +$1,528/yr (+$127/mo · 38.3%)
ⓘ Screening estimate from a state-policy table — verify with the county assessor before closing.
Nearby sold comps map
Loading sold comps map…
Walkable amenities ~0.75 mi
Loading nearby amenities…
Taxation est. · year 1
- Rental income
- $37,224
- − Mortgage interest
- −$18,429
- − Property taxes
- −$3,985
- − Insurance
- −$1,645
- − Repairs & maintenance
- −$2,978
- − Management
- −$2,978
- − HOA
- −$3,804
- − Depreciation
- −$9,571
- Taxable loss
- −$6,166
- Est. tax savings @ 24.0%
- +$1,480
- After-tax cash flow
- $749/yr
For passive investors: Depreciation is non-cash, so a rental often shows a tax loss while cash-flowing — sheltering income. Rental losses are passive: they offset passive income freely, and up to $25,000/yr can offset ordinary (W-2) income if you actively participate and your MAGI is under $100k (phasing out to $0 by $150k); unused losses carry forward. On sale, claimed depreciation is recaptured at up to 25%, and gains may owe capital-gains tax (a 1031 exchange can defer both). Figures are a year-1 estimate at your 24.0% rate — not tax advice; consult a CPA.
Schools (NCES district)
- District
- Norwalk School District
- NCES district ID
- 0903090
- Math proficiency
- 29% ▼ -11.00%
- Reading proficiency
- 44% ▼ -6.00%
- Median HH income
- $76,540
- Composite
- 34.07/100
- National rank
- #5297
- State rank
- #104 of 153 in CT
Livability — Norwalk
- Score
- 77/100
- State rank
- #41
- US rank
- #2966
Category grades
Schools grade is shown separately in the Schools card above.
Census & demographics
- Census place
- Norwalk, CT
- County
- Fairfield County · 765,532 people
- City population
- 89,026
- Metro
- Bridgeport-Stamford-Norwalk, CT
- Population (ZIP)
- 27,865
- Household income
- $111,341
- Rent vs Own
- Severe rent burden
- 995.0
Population outlook (Western Connecticut County) Hauer SSP2
- By 2040
- 685,031
Race, ethnicity, and origin ACS 2023
- Neighborhood character
- Diverse neighborhood (Simpson 0.64)
- Race & ethnicity
- White 52% Hispanic / Latino 25% Black 16% Two or more races 12% Asian 4%
- Hispanic origin (detail)
- Mexican 4% Puerto Rican 3% Dominican 3%
- Common ancestry
- Romanian 4% Hispanic 1% Slovak 1%
- Foreign-born
- 27% · Canada, Jamaica, Guatemala
- Languages at home
- 68% English-only · Spanish 22% Other Indo-European 5% Russian/Polish/Slavic 1%
Political lean MEDSL · Western Connecticut
- 2024 margin
- D (+19.1) · D 58.8% · R 39.7% · Other 1.6%
- All cycles
- 2024: D+19.1
Not yet ingested
- Civics
- —
Market trends
- HPI YoY
- ▼ -372.10%
- Current HPI
- 190.9291
- Rent YoY
- ▲ 2.11%
- Metro
- Bridgeport-Stamford-Norwalk, CT
- State GDP YoY
- ▲ 1.06%
- F500 in state
- 38
Industry mix (Fortune 500 HQ in CT)
| Industry | F500 HQs | Revenue |
|---|---|---|
| Industrial Machinery | 4 | $38B |
|
||
| Insurance | 3 | $71B |
|
||
| Financial Services | 2 | $25B |
|
||
| Transportation / Logistics | 2 | $18B |
|
||
| Healthcare | 1 | $247B |
|
||
| Telecommunications | 1 | $55B |
|
||
Price history
+178.8% since first listed3 events — show timeline
- 2026-05-13 Pending — Smart MLS
- 2026-05-09 Listed $329,000 Smart MLS
- 1999-06-30 Sold (Public Records) $118,000 Public Records
Property tax history
-0.7%/yrLatest (2023): $3,985 · +1.6% YoY. Source: county tax records.
Cash-flow waterfall
monthlySold comps — $/sqft
last 12 mo · ≤1 miLoading sold comps…