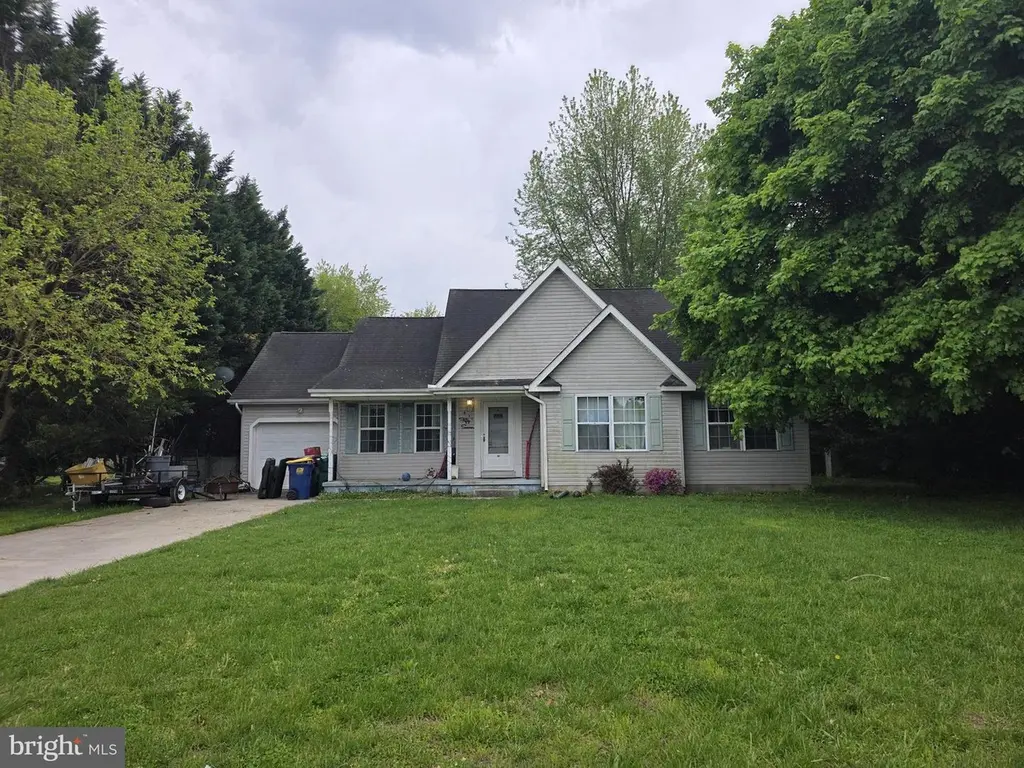
57 Andiron Ln
Felton, DE 19943
$250,000C
3 bd · 2.0 ba ·
1,299 sqft ·
Built 1999
· SingleFamily
· Pending
· 8 DOM
Cashflow @ list (25.0% down · 7.5%)
Estimated rent
$2,400/mo
Mortgage (P&I)
−$1,311
Tax + insurance
−$235
HOA
−$12
Vac / Maint / Mgmt
−$504
Net cashflow
$338/mo
Annual
$4,052/yr
Cap rate
7.91%
Cash-on-cash
5.79%
DSCR
1.26
1% rule
0.96%
Cash to close
$70,000
Investor read
- This is a 3-bed/2.0-bath single-family listed at $250k.
- At list price, monthly cash flow is $338 ($4k/yr) — positive.
- The deal already cash-flows at list — no discount required.
- To meet the 1% rule (rent ≥ 1% of price), the offer needs to be $240k (4.0% below list).
- Only 8 days on market — expect competitive offers; lowballing is unlikely to land.
- Recommended offer: $240k (4.0% below list) — sets the bar for 1% rule.
- Local home prices are declining (-3.0%/yr); year-one equity from $2k of loan paydown is wiped out by about $8k of value loss. Plan a longer hold.
- Location reads 72/100 on livability (#18 in DE) — a middle-class / working-renter tenant base. Strengths: cost of living A+, housing A+, health & safety A+; Watch: amenities F, commute F.
- Lake Forest School District (rural): math 26% / reading 44% proficiency, ranked #13 of 26 in DE (top 50%) — families likely to look elsewhere, expect single-tenant / working-renter base with shorter leases.
- Zoned schools: Chipman (W.T.) Middle School (math 24% / reading 45%, grade F, #12 of 36 statewide, top 34%, 965 students, 0% FRL); Lake Forest High School (math 27% / reading 47%, grade F, #16 of 40 statewide, top 38%, 870 students, 0% FRL) — zoned schools average 0% FRL vs 47% district-wide (47 pts lower); this property's tenant base skews higher-income than the district average.
- Market conditions: 136 active listings in the ZIP; 1 comparable units currently listed for rent nearby; 1,201 units permitted in Kent County in 2024 (116 in 5+ unit buildings).
- Kent County population projected at +22% by 2050 — long-run rental-demand tailwind backs the buy-and-hold thesis.
- Climate carrying-cost: major wind risk, 71% chance of damaging wind over 30y; extreme-heat days projected 7→16/yr by 2055 (HVAC capex compounding) — expect insurance premiums to compound above CPI over the hold.
- Cap rate 7.9% vs local median 4.3% in Felton — top-decile yield for the area; either an underpriced asset or a hidden risk that comps aren't pricing in. Stress-test before assuming the spread holds.
Questions for listing agent
- What does the HOA fee cover, when was the last increase, and are there any pending special assessments or reserve-fund shortfalls?
- Is there a deadline driving the sale (1031 exchange, divorce, estate, relocation)? That informs how much negotiation room exists.
- What's the average days-on-market for RENTAL listings here right now (not sales)? A rising rental-DOM trend means longer vacancies and softer asking-rent achievability than the comps imply.
- What's the recent tenant-quality profile in this submarket — average credit score on applications, eviction rate, late-payment / NSF rate, and stable-employment percentage? A property-management company in the area should have these aggregated.
- How much new for-sale + rental construction is in the pipeline within 1–3 miles? Heavy new supply typically softens prices + rents 12–24 months out; constrained supply supports both.
CashFlowRE · CFR-E82Y7ZD4F770FD
· Data 3 weeks ago
cashflowre.app · 2026-05-29