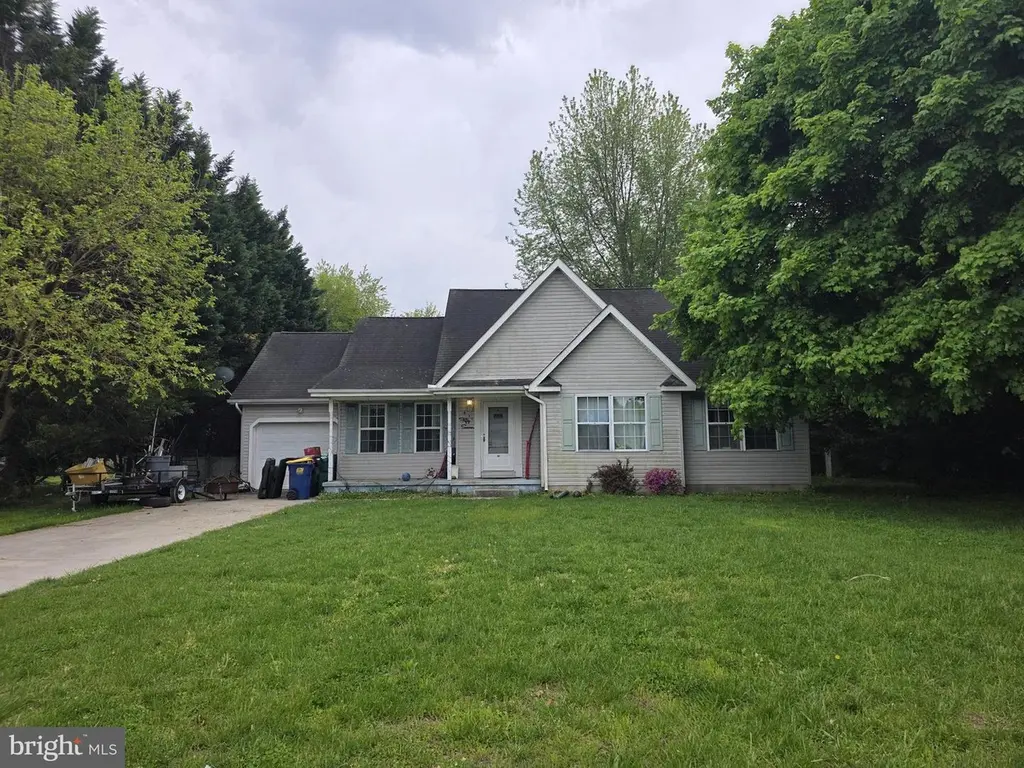
57 Andiron Ln · Felton, DE
Flood risk 1/10 · Minimal
- FEMA flood zone
- X (unshaded)
- Chance of flooding over 30 yrs
- 0.0%
- Est. flood insurance / yr
- $507 – $1,088
Fire risk 1/10 · Minimal
- Est. fire insurance / yr
- $476 – $884
Heat risk 8/10 · Major
- Hot days now (above 103°F)
- 7 days/yr
- Hot days in 30 yrs
- 16 days/yr
Wind risk 6/10 · Moderate
- Chance of severe wind over 30 yrs
- 71.0%
Air-quality risk 2/10 · Minimal
- Unhealthy air days now
- 1 days/yr
- Unhealthy air days in 30 yrs
- 2 days/yr
Risk factors via First Street. Map © Google.
Why this score? — see what drove the C grade
The composite is a weighted blend of 9 inputs, each scored 0–100. Each bar is that input's sub-score; the figure is the points it added to the 100-point composite (weight × sub-score).
- Cash flow +20.7/30.0
- ARV discount +15.0/15.0
- DSCR +6.6/10.0
- 1% rule +4.6/10.0
- Livability +3.6/5.0
- Schools +3.0/10.0
- Rent growth +2.5/5.0
- Condition / age +2.5/5.0
- Appreciation +0.0/10.0
$250,000
🖨 Deal sheet 📄 Offer letter ✓ Due diligence
Listing remarks
Located in a quiet cul-de-sac of the desirable neighborhood of Chimney Hill, where space to stretch is the norm , this ranch home, on a fenced in half acre, is ready for your vision and priced accordingly. The Septic has been inspected and the shed needs to be moved - at the Buyer's expense. The Seller will make zero repairs. The home needs a facelift, but the value is great for the savy investor or homeowner looking for sweat equity. Cash or conventional financing only. The HVAC was replaced in 2018. Don't let this opportunity pass you by!
Key facts
- Hvac replaced
- Quiet cul-de-sac
- Fenced in half acre
Tags
Property features AI
Finance
- HOA & community: HOA fee $140 annually (includes common area maintenance)
Exterior
- Parking: Attached front-entry garage with inside access and garage door opener (1-car); Driveway parking for 2 vehicles; Total of 3 parking spaces
- Utilities: Public water; On-site septic (gravity septic field); Natural gas hot water; Cable internet available
- Home design: Detached property; Shingle roof; Crawl space foundation
- Construction: Stick-built construction; Vinyl siding; Built as recorded by assessor
- Exterior features: Private lot; Porch(es); Chain link fence; Shed
Interior
- Kitchen: Gas range/oven; Refrigerator; Dishwasher
- Bedrooms: Three bedrooms on the main level
- Flooring: Carpet; Laminate
- Bathrooms: Two full bathrooms (both on the main level)
- Heating & cooling: Forced air heating (natural gas); Central air conditioning (electric)
- Interior features: Entry-level bedroom; Pantry; Master bathroom; Drywall walls and ceilings
- Laundry & utility: Washer (main floor); Electric dryer (main floor)
Neighborhood map
What this means for you Summary
Snapshot
- This is a 3-bed/2.0-bath single-family listed at $250k.
Deal economics
- At list price, monthly cash flow is $338 ($4k/yr) — positive.
- The deal already cash-flows at list — no discount required.
- To meet the 1% rule (rent ≥ 1% of price), the offer needs to be $240k (4.0% below list).
- Recommended offer: $240k (4.0% below list) — sets the bar for 1% rule.
- Cap rate 7.9% vs local median 4.3% in Felton — top-decile yield for the area; either an underpriced asset or a hidden risk that comps aren't pricing in. Stress-test before assuming the spread holds.
Location & tenants
- Location reads 72/100 on livability (#18 in DE) — a middle-class / working-renter tenant base. Strengths: cost of living A+, housing A+, health & safety A+; Watch: amenities F, commute F.
- Lake Forest School District (rural): math 26% / reading 44% proficiency, ranked #13 of 26 in DE (top 50%) — families likely to look elsewhere, expect single-tenant / working-renter base with shorter leases.
- Zoned schools: Chipman (W.T.) Middle School (math 24% / reading 45%, grade F, #12 of 36 statewide, top 34%, 965 students, 0% FRL); Lake Forest High School (math 27% / reading 47%, grade F, #16 of 40 statewide, top 38%, 870 students, 0% FRL) — zoned schools average 0% FRL vs 47% district-wide (47 pts lower); this property's tenant base skews higher-income than the district average.
- Market conditions: 136 active listings in the ZIP; 1 comparable units currently listed for rent nearby; 1,201 units permitted in Kent County in 2024 (116 in 5+ unit buildings).
Forward outlook
- Local home prices are declining (-3.0%/yr); year-one equity from $2k of loan paydown is wiped out by about $8k of value loss. Plan a longer hold.
- Kent County population projected at +22% by 2050 — long-run rental-demand tailwind backs the buy-and-hold thesis.
Negotiation context
- Only 8 days on market — expect competitive offers; lowballing is unlikely to land.
Risks & watch-outs
- Climate carrying-cost: major wind risk, 71% chance of damaging wind over 30y; extreme-heat days projected 7→16/yr by 2055 (HVAC capex compounding) — expect insurance premiums to compound above CPI over the hold.
Questions for the listing agent
- What does the HOA fee cover, when was the last increase, and are there any pending special assessments or reserve-fund shortfalls?
- Is there a deadline driving the sale (1031 exchange, divorce, estate, relocation)? That informs how much negotiation room exists.
- What's the average days-on-market for RENTAL listings here right now (not sales)? A rising rental-DOM trend means longer vacancies and softer asking-rent achievability than the comps imply.
- What's the recent tenant-quality profile in this submarket — average credit score on applications, eviction rate, late-payment / NSF rate, and stable-employment percentage? A property-management company in the area should have these aggregated.
- How much new for-sale + rental construction is in the pipeline within 1–3 miles? Heavy new supply typically softens prices + rents 12–24 months out; constrained supply supports both.
Investment metrics
- 1% rule
- 0.96% ✗
- Cap rate
- 7.91%
- Cash-on-cash
- 5.79%
- DSCR
- 1.26
- GRM
- 8.7
CMA / ARV
- ARV (median comp)
- $345,351
- List price
- $250,000
- Delta
- -27.61%
- Verdict
- UNDERPRICED
- Comps
- 20 within 1.0 mi
Show comp detail 11 sales within ~0.75 mi
| Address | Dist | Beds/Ba | Sqft | Sold | Price | $/sf | Match |
|---|---|---|---|---|---|---|---|
| 57 Andiron Ln | 0.00mi | 3/2.0 | 1,299 (0%) | 0mo | $225,000 | $173 | 100 |
| 238 Kindling Dr | 0.15mi | 3/2.0 | 1,250 (-4%) | 10mo | $329,900 | $264 | 79 |
| 465 Hearthstone Ln | 0.08mi | 3/2.0 | 1,299 (0%) | 23mo | $328,500 | $253 | 77 |
| 468 Hearthstone Ln | 0.05mi | 3/2.0 | 1,192 (-8%) | 10mo | $329,900 | $277 | 76 |
| Chimney Hill Rd | 0.53mi | 3/2.0 | 1,324 (+2%) | 13mo | $315,000 | $238 | 61 |
| 221 Kindling Dr | 0.19mi | 3/2.0 | 1,204 (-7%) | 23mo | $340,000 | $282 | 60 |
| 21 Seth Ct | 0.72mi | 3/2.0 | 1,350 (+4%) | 3mo | $350,000 | $259 | 58 |
| 1680 Peach Basket Rd | 0.44mi | 3/1.0 | 1,448 (+12%) | 0mo | $273,000 | $189 | 56 |
| 44 Rocky Spring Ct | 0.63mi | 3/2.0 | 1,365 (+5%) | 11mo | $350,000 | $256 | 52 |
| 2375 Chimney Hill Rd | 0.37mi | 2/1.0 (-1) | 1,168 (-10%) | 14mo | $264,000 | $226 | 45 |
| 151 New Castle Ave | 0.41mi | 3/1.0 | 1,120 (-14%) | 18mo | $200,000 | $179 | 39 |
Match score weights: distance 35% · size 25% · config 20% · recency 20%. Top-matched comps best support the ARV.
Projected returns pro-forma
-3.0% appreciation · 3.0% rent growth · sell at horizon
- IRR
- -7.4%
- Equity multiple
- 0.73×
- Total profit
- $-19,071
- Equity at exit
- $37,276
- IRR
- 2.2%
- Equity multiple
- 1.15×
- Total profit
- $10,812
- Equity at exit
- $21,615
Cash invested: $70,000 (down + closing). Projections, not guarantees.
Landlord ↔ Tenant lean methodology
- Overall (STATE)
- 70 Landlord-Friendly
- State Delaware
- 70 Landlord-Friendly · D+7
- County
- — inherits STATE
- City
- — inherits STATE
ZIP-level market 19943
- Home prices YoY
- -14.3%
- Active inventory
- 136
- Price-to-rent
- 8.7×
Monthly cashflow live
- Estimated rent
- $2,400 medium interval (Pro) →
- Mortgage (P&I)
- −$1,311
- Tax from tax record
- −$131 /mo · $1,573/yr
- Insurance
- −$104
- HOA
- −$12
- Vacancy / Maint / Mgmt
- −$504
- Net cashflow
- $338
Break-even live
UW: 25.0% down · 7.5% · 30yr · 1.5% tax · 5.0% vac · 8.0% maint · 8.0% mgmt
Financing live
Cash to close
- Down payment
- $62,500
- Closing costs
- $7,500
- Reserves months
- —
- Total cash needed
- —
Loan-product check · same deal, 3 products live
Conventional
25% down · 7.5% · 30yr
- Down + closing
- —
- Monthly P&I
- —
- Monthly cashflow
- —
- DSCR
- —
- Eligible?
- —
Personal DTI + credit; lowest rate.
DSCR
20% down · 8.5% · 30yr
- Down + closing
- —
- Monthly P&I
- —
- Monthly cashflow
- —
- DSCR
- —
- Eligible?
- —
No personal income docs; deal must DSCR.
Hard money
10% down · 12.0% · 12mo
- Down + closing
- —
- Monthly P&I
- —
- Monthly cashflow
- —
- DSCR
- —
- Eligible?
- —
Short-term bridge; refi at stabilization.
Rent comps 1 comps
| Address | Beds | Baths | Sqft | Rent | $/sqft | DOM | Units | Dist |
|---|---|---|---|---|---|---|---|---|
| 34 E Chimney Top Ln Felton, DE | 3.0 | 2.5 | 1586 | $2,400 | $1.51 | 43d | 1 | 0.30mi |
HOA detail
- Monthly dues
- $12 · $144/yr
Listing history 3 events
-
2026-05-08status Pending 546-char remark
-
2026-04-30$250,000 Active 546-char remark
-
1999-06-02soldstatus $106,467
ⓘ Source: listings_history table (triggers on properties + properties_extension) + one-shot
backfill from property_details.listing_events for pre-trigger history.
Tax reassessment forecast DE · Partial reset (capped growth)
- Current annual tax
- $1,573 · $131/mo
- Projected year-2 tax
- $1,573 · $131/mo
- Expected delta
- $0/yr ($0/mo · 0.0%)
ⓘ Screening estimate from a state-policy table — verify with the county assessor before closing.
Climate risk First Street
- Flood 1/10 Low FEMA zone X (unshaded) · 0% chance over 30 yrs
- Wildfire 1/10 Low
- Heat 8/10 Severe 7 d/yr ≥103°F today · 16 d/yr by 30 yrs out
- Wind 6/10 Major 71% chance of damaging wind over 30 yrs
- Air quality 2/10 Low 1 unhealthy d/yr today · 2 by 30 yrs out
Nearby sold comps map
Loading sold comps map…
Walkable amenities ~0.75 mi
Loading nearby amenities…
Taxation est. · year 1
- Rental income
- $28,800
- − Mortgage interest
- −$14,004
- − Property taxes
- −$1,573
- − Insurance
- −$1,250
- − Repairs & maintenance
- −$2,304
- − Management
- −$2,304
- − HOA
- −$144
- − Depreciation
- −$7,273
- Taxable loss
- −$52
- Est. tax savings @ 24.0%
- +$12
- After-tax cash flow
- $4,065/yr
For passive investors: Depreciation is non-cash, so a rental often shows a tax loss while cash-flowing — sheltering income. Rental losses are passive: they offset passive income freely, and up to $25,000/yr can offset ordinary (W-2) income if you actively participate and your MAGI is under $100k (phasing out to $0 by $150k); unused losses carry forward. On sale, claimed depreciation is recaptured at up to 25%, and gains may owe capital-gains tax (a 1031 exchange can defer both). Figures are a year-1 estimate at your 24.0% rate — not tax advice; consult a CPA.
Schools (NCES district)
- District
- Lake Forest School District
- NCES district ID
- 1000790
- Math proficiency
- 26% ▼ -23.00%
- Reading proficiency
- 44% ▼ -14.00%
- Median HH income
- $52,034
- Composite
- 30.47/100
- National rank
- #6225
- State rank
- #13 of 26 in DE
Livability — Felton
- Score
- 72/100
- State rank
- #18
- US rank
- #6154
Category grades
Schools grade is shown separately in the Schools card above.
Census & demographics
- Population (ZIP)
- 13,167
Population outlook (Kent County) Hauer SSP2
- Today (2025)
- 194,477 people
- By 2030
- 204,351 · +5.1%
- By 2040
- 222,135 · +14.2%
- By 2050
- 236,483 · +21.6%
- By 2075
- 266,327 · +36.9%
- By 2100
- 275,335 · +41.6%
Race, ethnicity, and origin ACS 2023
- Neighborhood character
- Predominantly White (73%)
- Race & ethnicity
- White 73% Black 18% Hispanic / Latino 5% Two or more races 4%
- Common ancestry
- Scotch-Irish 2% Portuguese 2% Romanian 2%
- Foreign-born
- 3% · Canada, China, Jamaica
- Languages at home
- 95% English-only · Spanish 4%
Political lean MEDSL · Kent
- 2024 margin
- Toss-up / Even · D 50.2% · R 48.2% · Other 1.7%
- 2008→2024 swing
- -7.8pp toward R · 2008: 9.8pp · 2024: 2.0pp
- All cycles
- 2024: D+2.0 2020: D+4.1 2016: R+4.9 2012: D+4.9 2008: D+9.8
Not yet ingested
- Civics
- —
Market trends
- HPI YoY
- ▼ -35.03%
- Current HPI
- 209.4766
- Rent YoY
- —
- Metro
- —
- State GDP YoY
- —
- F500 in state
- 0
Price history
+111.3% since first listed4 events — show timeline
- 2026-06-15 Sold (MLS) $225,000 BRIGHT MLS
- 2026-05-08 Pending — BRIGHT MLS
- 2026-04-30 Listed $250,000 BRIGHT MLS
- 1999-06-02 Sold (Public Records) $106,467 Public Records
Property tax history
+3.4%/yrLatest (2025): $1,573 · +2.2% YoY. Source: county tax records.
Cash-flow waterfall
monthlySold comps — $/sqft
last 12 mo · ≤1 miLoading sold comps…