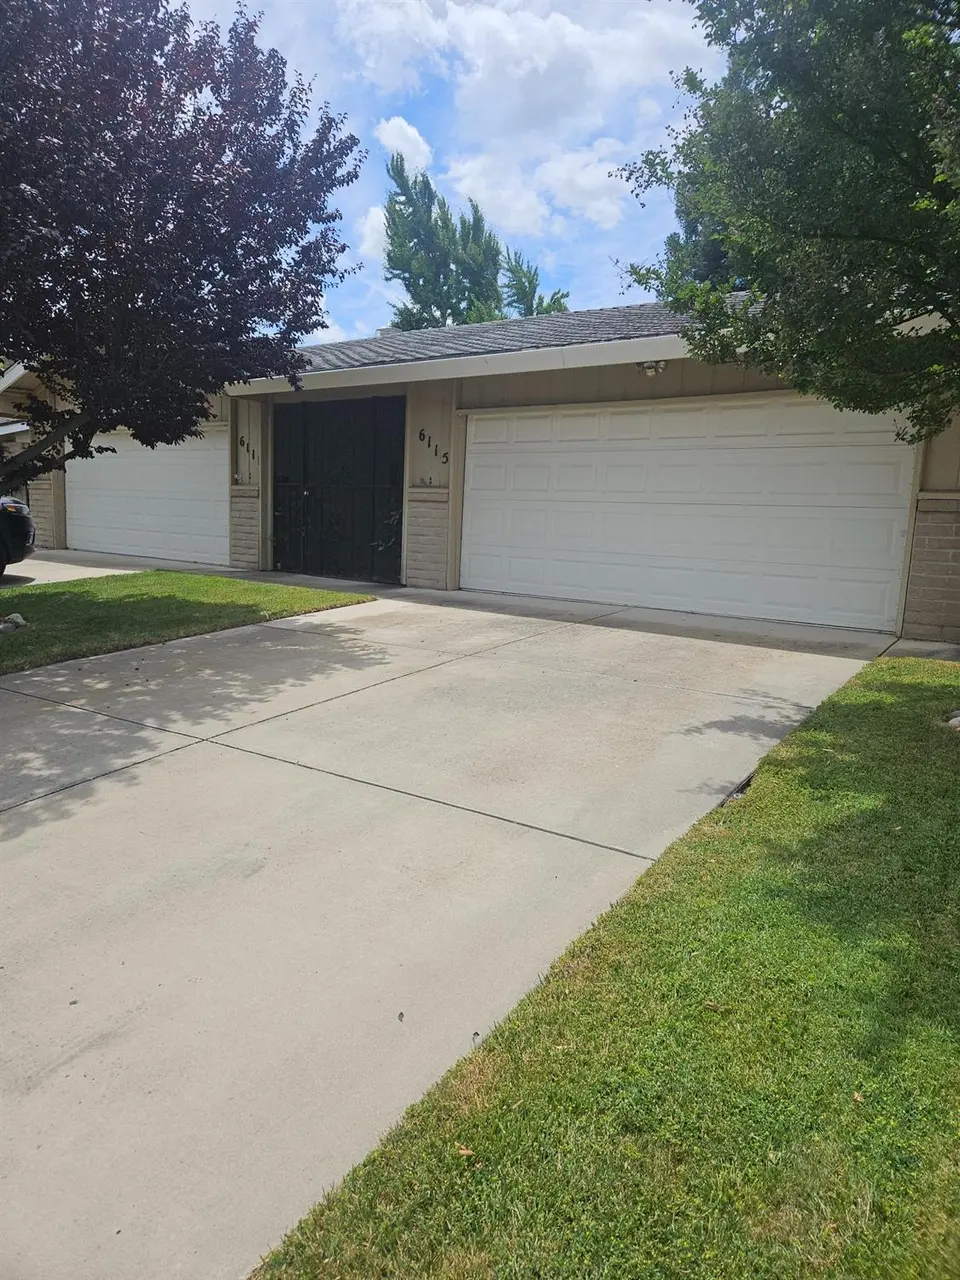
6111 - 6115 Grigsby Pl
Stockton, CA 95219
$485,000B
8 bd · 4.0 ba ·
2,009 sqft ·
Built 1972
· MultiFamily
· Pending
· 5 DOM
Cashflow @ list (25.0% down · 7.5%)
Estimated rent
$5,705/mo
Mortgage (P&I)
−$2,543
Tax + insurance
−$350
HOA
−$55
Vac / Maint / Mgmt
−$1,198
Net cashflow
$1,558/mo
Annual
$18,698/yr
Cap rate
10.15%
Cash-on-cash
13.77%
DSCR
1.61
1% rule
1.18%
Cash to close
$135,800
Investor read
- This is a 3 × 2-bed/1.0-bath units multifamily listed at $485k.
- At list price, monthly cash flow is $2k ($19k/yr) — positive. Per door: $519/mo.
- The deal already cash-flows at list — no discount required.
- Meets the 1% rule at list price ($6k rent vs $485k).
- Only 5 days on market — expect competitive offers; lowballing is unlikely to land.
- In year one you build about $52k of equity ($3k loan paydown + $48k appreciation (10.0% local appreciation)).
- Location reads 57/100 on livability (#734 in CA) — a working-class tenant base; expect higher turnover. Strengths: housing A+, health & safety A, amenities A-; Watch: employment C-, schools D-, crime F.
- Lincoln Unified (urban): math 26% / reading 41% proficiency, ranked #284 of 517 in CA (top 55%) — families likely to look elsewhere, expect single-tenant / working-renter base with shorter leases.
- Market conditions: Rents rising fast (+4.2%/yr); 213 active listings in the ZIP; high-income renter base; 3,779 units permitted in San Joaquin County in 2024 (0 in 5+ unit buildings).
- San Joaquin County population projected at +17% by 2050 — long-run rental-demand tailwind backs the buy-and-hold thesis.
- At projected returns (10.0% appreciation + 4.2% rent growth), your $136k cash investment doubles in ~2 years — after that, you're playing with house money.
- By year 2, paydown + projected appreciation supports a ~$83k cash-out refi (75% LTV) — recoverable capital for the next deal without selling this one.
- Climate carrying-cost: extreme-heat days projected 7→15/yr by 2055 (HVAC capex compounding) — expect insurance premiums to compound above CPI over the hold.
- Cap rate 10.1% vs local median 3.6% in Stockton — top-decile yield for the area; either an underpriced asset or a hidden risk that comps aren't pricing in. Stress-test before assuming the spread holds.
- At $5,705/mo this rent would consume 61% of the median local household income ($112k/yr) (locally 825% of renters already pay >50% of income on rent) — very limited rent-growth headroom before tenants either downsize or default.
Questions for listing agent
- Can we see the unit-by-unit rent roll, current vacancy, and any below-market leases? What's the average tenancy length?
- What capital expenditures (roof, boiler, parking lot, exteriors) have been made in the last 5 years, and what's planned in the next 2?
- Built in 1972 — when were the roof, HVAC, electrical panel, plumbing, and water heater last replaced?
- What does the HOA fee cover, when was the last increase, and are there any pending special assessments or reserve-fund shortfalls?
- Is there a deadline driving the sale (1031 exchange, divorce, estate, relocation)? That informs how much negotiation room exists.
- Schools are D-rated, which usually means shorter tenancies and higher turnover. Who's the typical renter profile here, and what's been the actual vacancy rate?
- Crime grade is F in this area — have there been break-ins, vandalism, or insurance claims at this property in the last 3 years? What carrier currently insures it and at what premium?
- What's the average days-on-market for RENTAL listings here right now (not sales)? A rising rental-DOM trend means longer vacancies and softer asking-rent achievability than the comps imply.
CashFlowRE · CFR-E87199CP4PH6HB
· Data 1 week ago
cashflowre.app · 2026-05-29