 Triplex
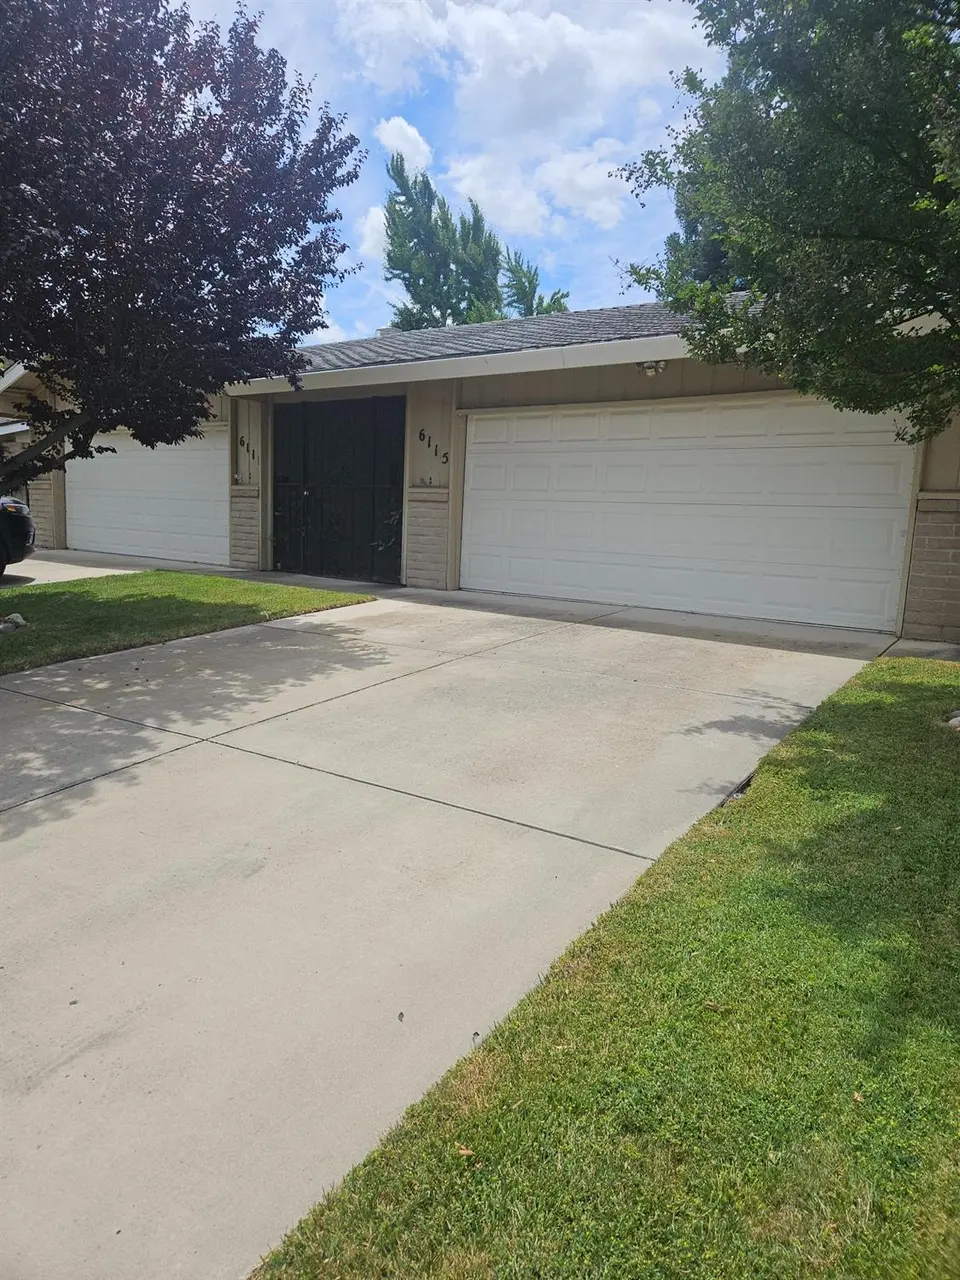
6111 - 6115 Grigsby Pl · Stockton, CA
Flood risk 1/10 · Minimal
- FEMA flood zone
- X
- Chance of flooding over 30 yrs
- 0.0%
- Est. flood insurance / yr
- $507 – $1,088
Fire risk 1/10 · Minimal
- Est. fire insurance / yr
- $659 – $1,223
Heat risk 7/10 · Major
- Hot days now (above 103°F)
- 7 days/yr
- Hot days in 30 yrs
- 15 days/yr
Wind risk 1/10 · Minimal
- Chance of severe wind over 30 yrs
- —
Air-quality risk 10/10 · Severe
- Unhealthy air days now
- 22 days/yr
- Unhealthy air days in 30 yrs
- 24 days/yr
Risk factors via First Street. Map © Google.
Why this score? — see what drove the B grade
The composite is a weighted blend of 9 inputs, each scored 0–100. Each bar is that input's sub-score; the figure is the points it added to the 100-point composite (weight × sub-score).
- Cash flow +28.3/30.0
- DSCR +10.0/10.0
- Appreciation +10.0/10.0
- ARV discount +7.5/15.0
- 1% rule +6.8/10.0
- Rent growth +3.5/5.0
- Schools +3.0/10.0
- Livability +2.9/5.0
- Condition / age +2.5/5.0
$485,000
🖨 Deal sheet 📄 Offer letter ✓ Due diligence
Multi-family units
County records classify this as Multi-Family (2-4 Unit). Listing-text estimate: 3 units. confirmed
Listing remarks
Welcome to 6111 & 6115 Grigsby Place! This family-owned duplex features 2 bedrooms and 1 bath on each side, along with a 2-car garage, and a private entrance security gate, all located in the highly desirable Lincoln Village West community. Both units offer dual-pane windows and ceiling fans in the living room, dining area, and both bedrooms. One unit is currently occupied by a dependable long-term tenant, providing immediate rental income. While the property could benefit from some TLC, it offers excellent potential as a value-add investment. Residents enjoy HOA amenities including beautifully maintained common areas, a clubhouse, and a swimming pool during the summer months. Conveni
Key facts
- Clubhouse
- Dual-pane windows
- Ceiling fans
Tags
Property features AI
Finance
- HOA & community: Mandatory association with clubhouse and pool; Annual association fee of $660
Exterior
- Parking: Detached garage with garage door opener; 4 parking spaces total
- Utilities: Public water; Public sewer; 220V electrical service; Cable connected
- Home design: Duplex residential income property; Single-story; House(s) style; Built in 1972
- Construction: Composition roof; Built in 1972
- Exterior features: Automatic sprinkler system; Composition roof
Interior
- Kitchen: Dishwasher; Garbage disposal
- Bedrooms: Two 2-bedroom units (each unit has 2 bedrooms)
- Flooring: Carpet; Tile; Linoleum
- Bathrooms: Each unit has 1 full bathroom
- Heating & cooling: Central heating; Central cooling
- Interior features: Dual-pane full windows; Ceiling fans
- Laundry & utility: Washer/dryer hookups
Neighborhood map
What this means for you Summary
Snapshot
- This is a 3 × 2-bed/1.0-bath units multifamily listed at $485k.
Deal economics
- At list price, monthly cash flow is $2k ($19k/yr) — positive. Per door: $519/mo.
- The deal already cash-flows at list — no discount required.
- Meets the 1% rule at list price ($6k rent vs $485k).
- Cap rate 10.1% vs local median 3.6% in Stockton — top-decile yield for the area; either an underpriced asset or a hidden risk that comps aren't pricing in. Stress-test before assuming the spread holds.
Location & tenants
- Location reads 57/100 on livability (#734 in CA) — a working-class tenant base; expect higher turnover. Strengths: housing A+, health & safety A, amenities A-; Watch: employment C-, schools D-, crime F.
- Lincoln Unified (urban): math 26% / reading 41% proficiency, ranked #284 of 517 in CA (top 55%) — families likely to look elsewhere, expect single-tenant / working-renter base with shorter leases.
- Market conditions: Rents rising fast (+4.2%/yr); 213 active listings in the ZIP; high-income renter base; 3,779 units permitted in San Joaquin County in 2024 (0 in 5+ unit buildings).
- At $5,705/mo this rent would consume 61% of the median local household income ($112k/yr) (locally 825% of renters already pay >50% of income on rent) — very limited rent-growth headroom before tenants either downsize or default.
Forward outlook
- In year one you build about $52k of equity ($3k loan paydown + $48k appreciation (10.0% local appreciation)).
- San Joaquin County population projected at +17% by 2050 — long-run rental-demand tailwind backs the buy-and-hold thesis.
- At projected returns (10.0% appreciation + 4.2% rent growth), your $136k cash investment doubles in ~2 years — after that, you're playing with house money.
- By year 2, paydown + projected appreciation supports a ~$83k cash-out refi (75% LTV) — recoverable capital for the next deal without selling this one.
Negotiation context
- Only 5 days on market — expect competitive offers; lowballing is unlikely to land.
Risks & watch-outs
- Climate carrying-cost: extreme-heat days projected 7→15/yr by 2055 (HVAC capex compounding) — expect insurance premiums to compound above CPI over the hold.
Questions for the listing agent
- Can we see the unit-by-unit rent roll, current vacancy, and any below-market leases? What's the average tenancy length?
- What capital expenditures (roof, boiler, parking lot, exteriors) have been made in the last 5 years, and what's planned in the next 2?
- Built in 1972 — when were the roof, HVAC, electrical panel, plumbing, and water heater last replaced?
- What does the HOA fee cover, when was the last increase, and are there any pending special assessments or reserve-fund shortfalls?
- Is there a deadline driving the sale (1031 exchange, divorce, estate, relocation)? That informs how much negotiation room exists.
- Schools are D-rated, which usually means shorter tenancies and higher turnover. Who's the typical renter profile here, and what's been the actual vacancy rate?
- Crime grade is F in this area — have there been break-ins, vandalism, or insurance claims at this property in the last 3 years? What carrier currently insures it and at what premium?
- What's the average days-on-market for RENTAL listings here right now (not sales)? A rising rental-DOM trend means longer vacancies and softer asking-rent achievability than the comps imply.
- What's the recent tenant-quality profile in this submarket — average credit score on applications, eviction rate, late-payment / NSF rate, and stable-employment percentage? A property-management company in the area should have these aggregated.
- How much new apartment / multifamily construction is in the pipeline within 1–3 miles? Heavy new supply (>2% of stock underway) typically softens rents 12–24 months out; light construction supports rent growth.
Investment metrics
- 1% rule
- 1.18% ✓
- Cap rate
- 10.15%
- Cash-on-cash
- 13.77%
- DSCR
- 1.61
- GRM
- 7.1
CMA / ARV
No comps found within radius.
Projected returns pro-forma
10.0% appreciation · 4.16% rent growth · sell at horizon
- IRR
- 34.9%
- Equity multiple
- 3.72×
- Total profit
- $369,959
- Equity at exit
- $436,926
- IRR
- 30.4%
- Equity multiple
- 8.55×
- Total profit
- $1,025,434
- Equity at exit
- $942,248
Cash invested: $135,800 (down + closing). Projections, not guarantees.
Landlord ↔ Tenant lean methodology
- Overall (STATE)
- 18 Strongly Tenant-Friendly
- State California
- 18 Strongly Tenant-Friendly · D+13
- County
- — inherits STATE
- City
- — inherits STATE
ZIP-level market 95219
- Home prices YoY
- 6.6%
- Rents YoY
- 4.2%
- Active inventory
- 213
- Price-to-rent
- 21.3×
Monthly cashflow live
- Estimated rent
- $5,705 high interval (Pro) →
- Mortgage (P&I)
- −$2,543
- Tax from tax record
- −$148 /mo · $1,780/yr
- Insurance
- −$202
- HOA
- −$55
- Vacancy / Maint / Mgmt
- −$1,198
- Net cashflow
- $1,558
Break-even live
3-unit breakdown (identical units grouped — click to expand)
| Units | Beds | Baths | Est. rent |
|---|---|---|---|
| 3× units | 2 | 1 | $5,706 |
| #1 | 2 | 1 | $1,902 |
| #2 | 2 | 1 | $1,902 |
| #3 | 2 | 1 | $1,902 |
| Total (3 units) | $5,705 | ||
UW: 25.0% down · 7.5% · 30yr · 1.5% tax · 5.0% vac · 8.0% maint · 8.0% mgmt
Financing live
Cash to close
- Down payment
- $121,250
- Closing costs
- $14,550
- Reserves months
- —
- Total cash needed
- —
Loan-product check · same deal, 3 products live
Conventional
25% down · 7.5% · 30yr
- Down + closing
- —
- Monthly P&I
- —
- Monthly cashflow
- —
- DSCR
- —
- Eligible?
- —
Personal DTI + credit; lowest rate.
DSCR
20% down · 8.5% · 30yr
- Down + closing
- —
- Monthly P&I
- —
- Monthly cashflow
- —
- DSCR
- —
- Eligible?
- —
No personal income docs; deal must DSCR.
Hard money
10% down · 12.0% · 12mo
- Down + closing
- —
- Monthly P&I
- —
- Monthly cashflow
- —
- DSCR
- —
- Eligible?
- —
Short-term bridge; refi at stabilization.
HOA detail
- Monthly dues
- $55 · $660/yr
- Likely covers
- poolsecurity
Listing history 5 events
-
2026-06-14statusdays on market $485,000 Pending 5 DOM
-
2026-06-13days on market $485,000 Active 4 DOM
-
2026-06-10days on market $485,000 Active 2 DOM
-
2026-06-09remarks 695-char remark
-
2026-06-09$485,000 Active 1 DOM
ⓘ Source: listings_history table (triggers on properties + properties_extension) + one-shot
backfill from property_details.listing_events for pre-trigger history.
Tax reassessment forecast CA · Resets to sale price
- Current annual tax
- $1,780 · $148/mo
- Projected year-2 tax
- $3,686 · $307/mo
- Expected delta
- +$1,906/yr (+$159/mo · 107.1%)
ⓘ Screening estimate from a state-policy table — verify with the county assessor before closing.
Climate risk First Street
- Flood 1/10 Low FEMA zone X · 0% chance over 30 yrs
- Wildfire 1/10 Low
- Heat 7/10 Severe 7 d/yr ≥103°F today · 15 d/yr by 30 yrs out
- Wind 1/10 Low
- Air quality 10/10 Extreme 22 unhealthy d/yr today · 24 by 30 yrs out
Nearby sold comps map
Loading sold comps map…
Walkable amenities ~0.75 mi
Loading nearby amenities…
Taxation est. · year 1
- Rental income
- $68,460
- − Mortgage interest
- −$27,168
- − Property taxes
- −$1,780
- − Insurance
- −$2,425
- − Repairs & maintenance
- −$5,477
- − Management
- −$5,477
- − HOA
- −$660
- − Depreciation
- −$14,109
- Taxable income
- $11,365
- Est. tax owed @ 24.0%
- −$2,728
- After-tax cash flow
- $15,971/yr
For passive investors: Depreciation is non-cash, so a rental often shows a tax loss while cash-flowing — sheltering income. Rental losses are passive: they offset passive income freely, and up to $25,000/yr can offset ordinary (W-2) income if you actively participate and your MAGI is under $100k (phasing out to $0 by $150k); unused losses carry forward. On sale, claimed depreciation is recaptured at up to 25%, and gains may owe capital-gains tax (a 1031 exchange can defer both). Figures are a year-1 estimate at your 24.0% rate — not tax advice; consult a CPA.
Schools (NCES district)
- District
- Lincoln Unified
- NCES district ID
- 0621690
- Math proficiency
- 26% ▼ -11.00%
- Reading proficiency
- 41% ▼ -11.00%
- Median HH income
- $56,356
- Composite
- 29.66/100
- National rank
- #6465
- State rank
- #284 of 517 in CA
Livability — Stockton
- Score
- 57/100
- State rank
- #734
- US rank
- #21638
Category grades
Schools grade is shown separately in the Schools card above.
Census & demographics
- Census place
- Stockton, CA
- County
- San Joaquin County · 729,570 people
- City population
- 332,006
- Metro
- Stockton, CA
- Population (ZIP)
- 31,713
- Household income
- $112,268
- Rent vs Own
- Severe rent burden
- 825.0
Population outlook (San Joaquin County) Hauer SSP2
- Today (2025)
- 796,965 people
- By 2030
- 828,849 · +4.0%
- By 2040
- 885,611 · +11.1%
- By 2050
- 929,798 · +16.7%
- By 2075
- 994,578 · +24.8%
- By 2100
- 971,291 · +21.9%
Race, ethnicity, and origin ACS 2023
- Neighborhood character
- Highly diverse neighborhood (Simpson 0.75)
- Race & ethnicity
- White 33% Hispanic / Latino 30% Asian 21% Two or more races 18% Black 9%
- Hispanic origin (detail)
- Mexican 27%
- Common ancestry
- Slovak 2% Italian 2% Portuguese 1%
- Foreign-born
- 20% · Canada, China, Vietnam
- Languages at home
- 69% English-only · Spanish 14% Other Indo-European 4% Other Asian/Pacific 4%
Political lean MEDSL · San Joaquin
- 2024 margin
- Toss-up / Even · D 48.0% · R 48.9% · Other 3.0%
- 2008→2024 swing
- -11.6pp toward R · 2008: 10.7pp · 2024: -0.9pp
- All cycles
- 2024: R+0.9 2020: D+13.9 2016: D+12.9 2012: D+8.9 2008: D+10.7
Not yet ingested
- Civics
- —
Market trends
- HPI YoY
- ▲ 69.26%
- Current HPI
- 1122.61
- Rent YoY
- ▲ 4.16%
- Metro
- Stockton, CA
- State GDP YoY
- ▲ 3.21%
- F500 in state
- 116
Industry mix (Fortune 500 HQ in CA)
| Industry | F500 HQs | Revenue |
|---|---|---|
| Technology | 27 | $1,492B |
|
||
| Financial Services | 3 | $174B |
|
||
| Retail | 3 | $44B |
|
||
| Insurance | 3 | $26B |
|
||
| Media / Entertainment | 2 | $115B |
|
||
| Pharmaceuticals / Biotech | 2 | $62B |
|
||
Property tax history
+1.7%/yrLatest (2025): $1,780 · +4.2% YoY. Source: county tax records.
Cash-flow waterfall
monthlySold comps — $/sqft
last 12 mo · ≤1 miLoading sold comps…