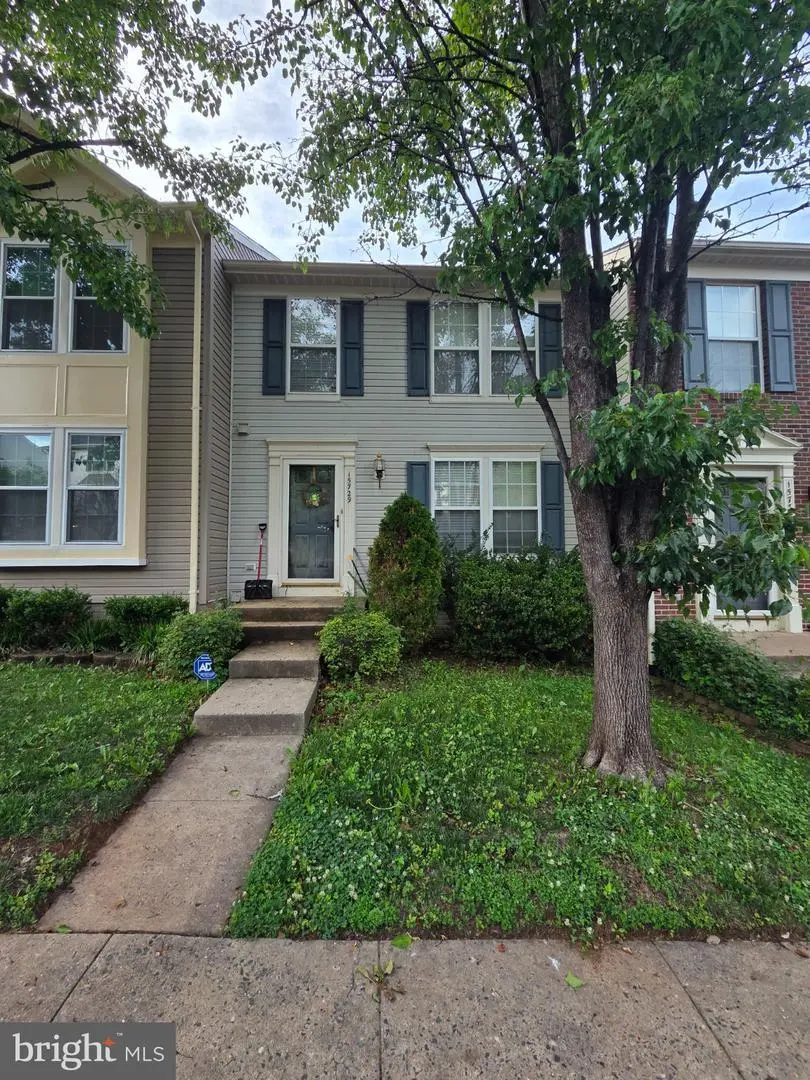
15729 Viewpoint Cir
Montclair, VA 22025
$420,000D+
3 bd · 2.5 ba ·
2,192 sqft ·
Built 2001
· Townhouse
· Pending
· 2 DOM
Cashflow @ list (25.0% down · 7.5%)
Estimated rent
$3,125/mo
Mortgage (P&I)
−$2,203
Tax + insurance
−$551
HOA
−$75
Vac / Maint / Mgmt
−$656
Net cashflow
$-359/mo
Annual
$-4,313/yr
Cap rate
5.27%
Cash-on-cash
-3.67%
DSCR
0.84
1% rule
0.74%
Cash to close
$117,600
Investor read
- This is a 3-bed/2.5-bath townhouse listed at $420k.
- At list price, monthly cash flow is $-359 ($-4k/yr) — negative.
- To cash-flow at today's rent, offer at most $357k (15.1% below list).
- To meet the 1% rule (rent ≥ 1% of price), the offer needs to be $313k (25.6% below list).
- Only 2 days on market — expect competitive offers; lowballing is unlikely to land.
- Recommended offer: $313k (25.6% below list) — sets the bar for 1% rule.
- In year one you build about $1k of equity ($3k loan paydown + $-2k appreciation (-0.4% local appreciation)).
- Location reads 73/100 on livability (#171 in VA) — a middle-class / working-renter tenant base. Strengths: crime A+, employment A+, housing A+; Watch: amenities F, commute F, cost of living F.
- Prince William County Public School District (suburban): math 54% / reading 72% proficiency, ranked #30 of 131 in VA (top 23%) — acceptable for families but not a draw, mixed tenant base, ~2y average lease.
- Zoned schools: Ashland Elementary (math 77% / reading 88%, grade A+, #98 of 1,108 statewide, top 9%, 766 students, 19% FRL); Louise A. Benton Middle (math 53% / reading 81%, grade A-, #103 of 342 statewide, top 31%, 1,384 students, 21% FRL); Forest Park High (math 53% / reading 87%, grade B+, #151 of 319 statewide, top 49%, 2,308 students, 34% FRL).
- Market conditions: 78 active listings in the ZIP; 13 comparable units currently listed for rent nearby; rentals at typical pace (median 21d on market — plan ~3-4 weeks tenant-placement turnaround); high-income renter base; 1,418 units permitted in Prince William County in 2024 (625 in 5+ unit buildings).
- Prince William County population projected at +37% by 2050 — long-run rental-demand tailwind backs the buy-and-hold thesis.
- 2 sale attempts since 20y ago with the ask held roughly flat each time — persistent listings suggest the price (not the market) is what's stuck; bring a comps-based counter.
- Current owner paid $350k; 20% above their basis — modest negotiation headroom, anchor on the comps not their cost.
- Climate carrying-cost: extreme-heat days projected 7→16/yr by 2055 (HVAC capex compounding) — expect insurance premiums to compound above CPI over the hold.
- Cap rate 5.3% vs local median 3.5% in Montclair — top-decile yield for the area; either an underpriced asset or a hidden risk that comps aren't pricing in. Stress-test before assuming the spread holds.
Questions for listing agent
- What do current leases actually rent for vs. the listed asking? Can we see a recent rent roll and the last 12 months of T-12 income?
- What does the HOA fee cover, when was the last increase, and are there any pending special assessments or reserve-fund shortfalls?
- Is there a deadline driving the sale (1031 exchange, divorce, estate, relocation)? That informs how much negotiation room exists.
- The area grade is low — what's the realistic commute time and amenity access for the typical tenant pool here? Any planned neighborhood developments (good or bad) we should know about?
- What's the average days-on-market for RENTAL listings here right now (not sales)? A rising rental-DOM trend means longer vacancies and softer asking-rent achievability than the comps imply.
- What's the recent tenant-quality profile in this submarket — average credit score on applications, eviction rate, late-payment / NSF rate, and stable-employment percentage? A property-management company in the area should have these aggregated.
- How much new for-sale + rental construction is in the pipeline within 1–3 miles? Heavy new supply typically softens prices + rents 12–24 months out; constrained supply supports both.
CashFlowRE · CFR-E9D511DR6JAHVQ
· Data 2 weeks ago
cashflowre.app · 2026-05-29