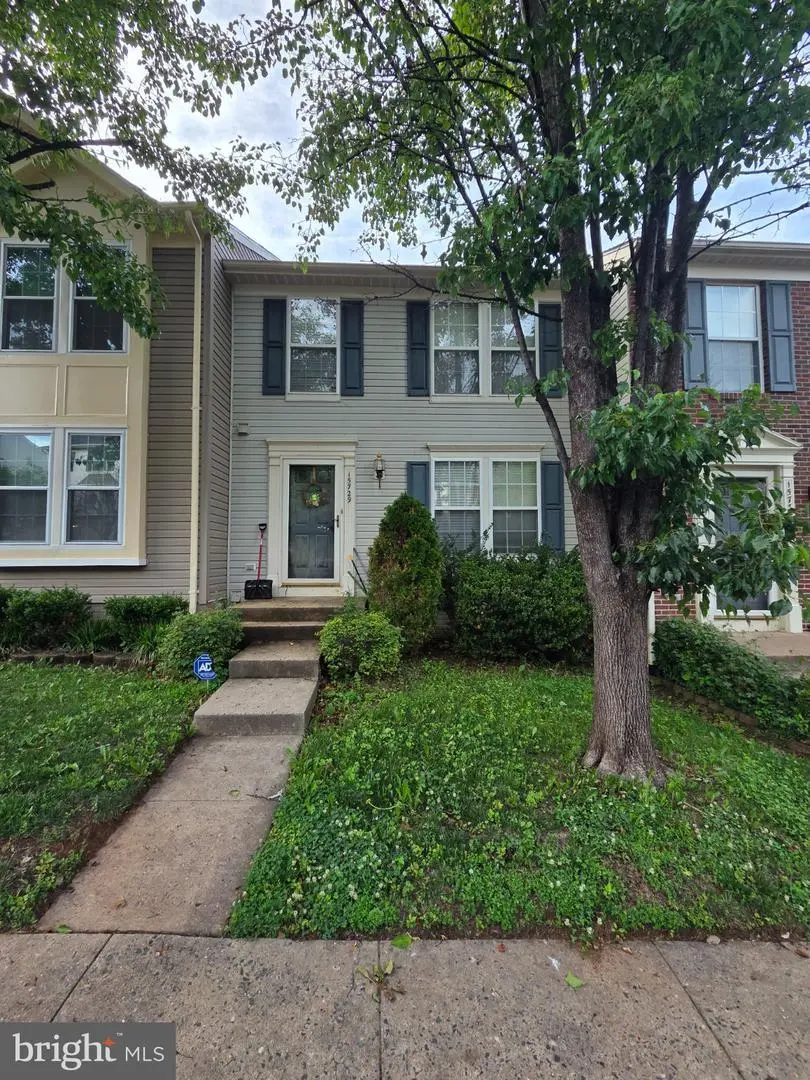
15729 Viewpoint Cir · Montclair, VA
Flood risk 1/10 · Minimal
- FEMA flood zone
- X (unshaded)
- Chance of flooding over 30 yrs
- 0.0%
- Est. flood insurance / yr
- $473 – $860
Fire risk 3/10 · Minor
- Est. fire insurance / yr
- $666 – $1,236
Heat risk 8/10 · Major
- Hot days now (above 103°F)
- 7 days/yr
- Hot days in 30 yrs
- 16 days/yr
Wind risk 4/10 · Minor
- Chance of severe wind over 30 yrs
- 18.0%
Air-quality risk 2/10 · Minimal
- Unhealthy air days now
- 2 days/yr
- Unhealthy air days in 30 yrs
- 2 days/yr
Risk factors via First Street. Map © Google.
Why this score? — see what drove the D+ grade
The composite is a weighted blend of 9 inputs, each scored 0–100. Each bar is that input's sub-score; the figure is the points it added to the 100-point composite (weight × sub-score).
- ARV discount +15.0/15.0
- Cash flow +8.6/30.0
- Schools +5.8/10.0
- Appreciation +4.8/10.0
- Livability +3.7/5.0
- Rent growth +2.5/5.0
- Condition / age +2.5/5.0
- 1% rule +2.4/10.0
- DSCR +2.4/10.0
$420,000
🖨 Deal sheet (PDF) 📄 Offer letter ✓ Due diligence
Listing remarks MLS
PRIDE OF OWNERSHIP SHOWS IN THIS 3 BEDROOM, 2.5 BATH TOWNHOUSE. ALL NEUTRAL DECOR, HARDWOODS IN KITCHEN AND SUNROOM, KITCHEN W/ ISLAND, MASTER BATH W/ JACUZZI TUB, SEP. SHOWER, DBL. SINK VANITY, TWO WALK IN CLOSETS, GAS FIREPLACE IN LL REC. ROOM, BERBER CARPET IN LL, BRICK PATIO, DECK OFF KITCHEN. JUST MOVE IN! EASY TO SHOW. JUST LEAVE MESSAGE AND SHOW.
Key facts
- Rec center
- Resort-style pools
- Community library
Tags
Property features AI
Finance
- Other: Fee simple ownership; Property manager present; Above-grade finished area and below-grade finished area reported by assessor
- HOA & community: HOA fee $75 monthly; Association recreation fee $450
Exterior
- Parking: Parking lot with 2 spaces (total garage and parking spaces: 2)
- Utilities: Public water; Public sewer
- Home design: Interior townhouse/rowhouse; Entry level is floor 2
- Construction: Combination construction materials; Slab foundation
- Exterior features: Community pool; Not in a federal flood zone; Ground rent paid annually
Interior
- Bedrooms: Three bedrooms on the upper level
- Bathrooms: Two full bathrooms (all upper levels); One half bathroom on the main level
- Heating & cooling: Central heating (natural gas); Central air conditioning (electric); Natural gas hot water
- Interior features: One fireplace; Full basement
Neighborhood map
What this means for you Summary
Snapshot
- This is a 3-bed/2.5-bath townhouse listed at $420k.
Deal economics
- At list price, monthly cash flow is $-359 ($-4k/yr) — negative.
- To cash-flow at today's rent, offer at most $357k (15.1% below list).
- To meet the 1% rule (rent ≥ 1% of price), the offer needs to be $313k (25.6% below list).
- Recommended offer: $313k (25.6% below list) — sets the bar for 1% rule.
- Cap rate 5.3% vs local median 3.5% in Montclair — top-decile yield for the area; either an underpriced asset or a hidden risk that comps aren't pricing in. Stress-test before assuming the spread holds.
Location & tenants
- Location reads 73/100 on livability (#171 in VA) — a middle-class / working-renter tenant base. Strengths: crime A+, employment A+, housing A+; Watch: amenities F, commute F, cost of living F.
- Prince William County Public School District (suburban): math 54% / reading 72% proficiency, ranked #30 of 131 in VA (top 23%) — acceptable for families but not a draw, mixed tenant base, ~2y average lease.
- Zoned schools: Ashland Elementary (math 77% / reading 88%, grade A+, #98 of 1,108 statewide, top 9%, 766 students, 19% FRL); Louise A. Benton Middle (math 53% / reading 81%, grade A-, #103 of 342 statewide, top 31%, 1,384 students, 21% FRL); Forest Park High (math 53% / reading 87%, grade B+, #151 of 319 statewide, top 49%, 2,308 students, 34% FRL).
- Market conditions: 78 active listings in the ZIP; 13 comparable units currently listed for rent nearby; rentals at typical pace (median 21d on market — plan ~3-4 weeks tenant-placement turnaround); high-income renter base; 1,418 units permitted in Prince William County in 2024 (625 in 5+ unit buildings).
Forward outlook
- In year one you build about $1k of equity ($3k loan paydown + $-2k appreciation (-0.4% local appreciation)).
- Prince William County population projected at +37% by 2050 — long-run rental-demand tailwind backs the buy-and-hold thesis.
Negotiation context
- Only 2 days on market — expect competitive offers; lowballing is unlikely to land.
- 2 sale attempts since 20y ago with the ask held roughly flat each time — persistent listings suggest the price (not the market) is what's stuck; bring a comps-based counter.
- Current owner paid $350k; 20% above their basis — modest negotiation headroom, anchor on the comps not their cost.
Risks & watch-outs
- Climate carrying-cost: extreme-heat days projected 7→16/yr by 2055 (HVAC capex compounding) — expect insurance premiums to compound above CPI over the hold.
Questions for the listing agent
- What do current leases actually rent for vs. the listed asking? Can we see a recent rent roll and the last 12 months of T-12 income?
- What does the HOA fee cover, when was the last increase, and are there any pending special assessments or reserve-fund shortfalls?
- Is there a deadline driving the sale (1031 exchange, divorce, estate, relocation)? That informs how much negotiation room exists.
- The area grade is low — what's the realistic commute time and amenity access for the typical tenant pool here? Any planned neighborhood developments (good or bad) we should know about?
- What's the average days-on-market for RENTAL listings here right now (not sales)? A rising rental-DOM trend means longer vacancies and softer asking-rent achievability than the comps imply.
- What's the recent tenant-quality profile in this submarket — average credit score on applications, eviction rate, late-payment / NSF rate, and stable-employment percentage? A property-management company in the area should have these aggregated.
- How much new for-sale + rental construction is in the pipeline within 1–3 miles? Heavy new supply typically softens prices + rents 12–24 months out; constrained supply supports both.
Investment metrics
- 1% rule
- 0.74% ✗
- Cap rate
- 5.27%
- Cash-on-cash
- -3.67%
- DSCR
- 0.84
- GRM
- 11.2
CMA / ARV
- ARV (on-the-fly)
- $541,424
- Comps found
- 12
Show comp detail 12 sales within ~0.75 mi
| Address | Dist | Beds/Ba | Sqft | Sold | Price | $/sf | Match |
|---|---|---|---|---|---|---|---|
| 15795 Widewater Dr | 0.23mi | 3/3.5 | 2,181 (-0%) | 2mo | $560,000 | $257 | 83 |
| 15729 Lansdale Pl | 0.14mi | 3/3.0 | 2,022 (-8%) | 2mo | $500,000 | $247 | 77 |
| 15461 Port Washington Ct | 0.32mi | 4/3.5 (+1) | 2,160 (-2%) | 4mo | $500,000 | $231 | 70 |
| 15719 Lansdale Pl | 0.12mi | 3/3.0 | 1,936 (-12%) | 4mo | $500,000 | $258 | 70 |
| 15767 Widewater Dr | 0.18mi | 3/3.5 | 1,934 (-12%) | 1mo | $540,000 | $279 | 67 |
| 15745 Widewater Dr | 0.14mi | 4/3.5 (+1) | 1,966 (-10%) | 4mo | $530,000 | $270 | 64 |
| 15327 Inlet Pl | 0.53mi | 3/3.5 | 2,079 (-5%) | 1mo | $488,000 | $235 | 62 |
| 5121 Spring Branch Blvd | 0.44mi | 3/3.5 | 2,017 (-8%) | 1mo | $460,000 | $228 | 61 |
| 5251 Spring Branch Blvd | 0.28mi | 3/3.5 | 1,907 (-13%) | 2mo | $465,000 | $244 | 60 |
| 15301 Waters Edge Ct | 0.44mi | 4/3.5 (+1) | 2,045 (-7%) | 1mo | $485,000 | $237 | 59 |
| 15661 Montview Dr | 0.35mi | 3/3.5 | 1,949 (-11%) | 5mo | $498,000 | $256 | 57 |
| 15343 Inlet Pl | 0.49mi | 3/3.5 | 1,979 (-10%) | 1mo | $445,000 | $225 | 56 |
Match score weights: distance 35% · size 25% · config 20% · recency 20%. Top-matched comps best support the ARV.
Projected returns pro-forma
-0.41% appreciation · 3.0% rent growth · sell at horizon
- IRR
- -8.1%
- Equity multiple
- 0.63×
- Total profit
- $-43,181
- Equity at exit
- $113,442
- IRR
- -1.8%
- Equity multiple
- 0.82×
- Total profit
- $-20,848
- Equity at exit
- $129,743
Cash invested: $117,600 (down + closing). Projections, not guarantees.
Landlord ↔ Tenant lean methodology
- Overall (STATE)
- 55 Moderately Landlord-Leaning
- State Virginia
- 55 Moderately Landlord-Leaning · D+2
- County
- — inherits STATE
- City
- — inherits STATE
ZIP-level market 22025
- Home prices YoY
- -0.1%
- Active inventory
- 78
- Price-to-rent
- 11.2×
Monthly cashflow live
- Estimated rent
- $3,125 high interval (Pro) →
- Mortgage (P&I)
- −$2,203
- Tax from tax record
- −$376 /mo · $4,508/yr
- Insurance
- −$175
- HOA
- −$75
- Vacancy / Maint / Mgmt
- −$656
- Net cashflow
- $-359
Break-even live
Sensitivity live
| Price | -10% $-122 | -5% $-241 | +0% $-359 | +5% $-478 | +10% $-597 |
|---|---|---|---|---|---|
| Rent | -10% $-606 | -5% $-483 | +0% $-359 | +5% $-236 | +10% $-113 |
| Rate | -1.0pp $-148 | -0.5pp $-253 | base $-359 | +0.5pp $-468 | +1.0pp $-579 |
UW: 25.0% down · 7.5% · 30yr · 1.5% tax · 5.0% vac · 8.0% maint · 8.0% mgmt
Financing live
Cash to close
- Down payment
- $105,000
- Closing costs
- $12,600
- Reserves months
- —
- Total cash needed
- —
Loan-product check · same deal, 3 products live
Conventional
25% down · 7.5% · 30yr
- Down + closing
- —
- Monthly P&I
- —
- Monthly cashflow
- —
- DSCR
- —
- Eligible?
- —
Personal DTI + credit; lowest rate.
DSCR
20% down · 8.5% · 30yr
- Down + closing
- —
- Monthly P&I
- —
- Monthly cashflow
- —
- DSCR
- —
- Eligible?
- —
No personal income docs; deal must DSCR.
Hard money
10% down · 12.0% · 12mo
- Down + closing
- —
- Monthly P&I
- —
- Monthly cashflow
- —
- DSCR
- —
- Eligible?
- —
Short-term bridge; refi at stabilization.
Rent comps 13 comps
| Address | Beds | Baths | Sqft | Rent | $/sqft | DOM | Units | Dist |
|---|---|---|---|---|---|---|---|---|
| 15375 Inlet Pl Dumfries, VA | 3.0 | 3.5 | 1410 | $2,462 | $1.75 | 26d | 1 | 0.42mi |
| 15230 Streamside Ct Dumfries, VA | 3.0 | 1.5 | 1740 | $2,400 | $1.38 | 14d | 1 | 0.44mi |
| 15337 Edgehill Dr Dumfries, VA | 4.0 | 2.5 | 1534 | $3,400 | $2.22 | 4d | 1 | 0.45mi |
| 15337 Edgehill Dr Dumfries, VA | 4.0 | 2.5 | 1534 | $3,600 | $2.35 | 45d | 1 | 0.45mi |
| 15873 Montview Dr Dumfries, VA | 4.0 | 2.5 | 1824 | $3,350 | $1.84 | 26d | 1 | 0.53mi |
| 15310 Holly Hill Dr Dumfries, VA | 3.0 | 2.5 | 2856 | $3,300 | $1.16 | 14d | 1 | 0.65mi |
| 15310 Holly Hill Dr Dumfries, VA | 3.0 | 2.5 | 1820 | $3,300 | $1.81 | 20d | 1 | 0.65mi |
| 5570 Assateague Pl Manassas, VA | 4.0 | 3.5 | 2300 | $3,500 | $1.52 | 13d | 1 | 1.05mi |
| 5570 Assateague Pl Manassas, VA | 3.0 | 3.5 | 2600 | $3,500 | $1.35 | 7d | 1 | 1.05mi |
| 15462 Windsong Ln Dumfries, VA | 3.0 | 3.5 | 1846 | $2,500 | $1.35 | 45d | 1 | 1.17mi |
| 15516 Three Otters Pl Manassas, VA | 3.0 | 3.5 | 1728 | $2,690 | $1.56 | 45d | 1 | 1.17mi |
| 15718 Cranberry Ct Dumfries, VA | 4.0 | 3.0 | 1920 | $3,000 | $1.56 | 0d | 1 | 1.23mi |
| 15385 Bevanwood Dr Woodbridge, VA | 4.0 | 3.5 | 2816 | $3,900 | $1.38 | 45d | 1 | 1.31mi |
HOA detail
- Monthly dues
- $75 · $900/yr
- Likely covers
- gas
Listing history 4 events
-
2026-06-04status $420,000 Pending 2 DOM
-
2026-06-03days on market $420,000 Active 2 DOM
-
2026-06-01remarks 687-char remark
-
2026-06-01$420,000 Active 1 DOM
ⓘ Source: listings_history table (triggers on properties + properties_extension) + one-shot
backfill from property_details.listing_events for pre-trigger history.
Tax reassessment forecast VA · Resets to sale price
- Current annual tax
- $4,508 · $376/mo
- Projected year-2 tax
- $4,508 · $376/mo
- Expected delta
- $0/yr ($0/mo · 0.0%)
ⓘ Screening estimate from a state-policy table — verify with the county assessor before closing.
Climate risk First Street
- Flood 1/10 Low FEMA zone X (unshaded) · 0% chance over 30 yrs
- Wildfire 3/10 Moderate
- Heat 8/10 Severe 7 d/yr ≥103°F today · 16 d/yr by 30 yrs out
- Wind 4/10 Moderate 18% chance of damaging wind over 30 yrs
- Air quality 2/10 Low 2 unhealthy d/yr today · 2 by 30 yrs out
Nearby sold comps map
Loading sold comps map…
Walkable amenities ~0.75 mi
Loading nearby amenities…
Taxation est. · year 1
- Rental income
- $37,500
- − Mortgage interest
- −$23,527
- − Property taxes
- −$4,508
- − Insurance
- −$2,100
- − Repairs & maintenance
- −$3,000
- − Management
- −$3,000
- − HOA
- −$900
- − Depreciation
- −$12,218
- Taxable loss
- −$11,753
- Est. tax savings @ 24.0%
- +$2,821
- After-tax cash flow
- $-1,493/yr
For passive investors: Depreciation is non-cash, so a rental often shows a tax loss while cash-flowing — sheltering income. Rental losses are passive: they offset passive income freely, and up to $25,000/yr can offset ordinary (W-2) income if you actively participate and your MAGI is under $100k (phasing out to $0 by $150k); unused losses carry forward. On sale, claimed depreciation is recaptured at up to 25%, and gains may owe capital-gains tax (a 1031 exchange can defer both). Figures are a year-1 estimate at your 24.0% rate — not tax advice; consult a CPA.
Schools (NCES district)
- District
- Prince William County Public School District
- NCES district ID
- 5103130
- Math proficiency
- 54% ▼ -28.00%
- Reading proficiency
- 72% ▼ -7.00%
- Median HH income
- $96,347
- Composite
- 57.92/100
- National rank
- #1041
- State rank
- #30 of 131 in VA
Livability — Montclair
- Score
- 73/100
- State rank
- #171
- US rank
- #5378
Category grades
Schools grade is shown separately in the Schools card above.
Census & demographics
- Census place
- Montclair, VA
- County
- Prince William County · 452,627 people
- Metro
- Washington-Arlington-Alexandria, DC-VA-MD-WV
- Population (ZIP)
- 19,356
- Household income
- $150,306
- Rent vs Own
- Severe rent burden
- 69.0
Population outlook (Prince William County) Hauer SSP2
- Today (2025)
- 539,759 people
- By 2030
- 582,629 · +7.9%
- By 2040
- 665,916 · +23.4%
- By 2050
- 740,796 · +37.2%
- By 2075
- 900,980 · +66.9%
- By 2100
- 985,833 · +82.6%
Race, ethnicity, and origin ACS 2023
- Neighborhood character
- Diverse neighborhood (Simpson 0.66)
- Race & ethnicity
- White 52% Black 23% Two or more races 13% Hispanic / Latino 12% Asian 6%
- Hispanic origin (detail)
- Mexican 2% Puerto Rican 3%
- Common ancestry
- Romanian 3% Slovak 2% Italian 2%
- Foreign-born
- 13% · Canada, Jamaica, Vietnam
- Languages at home
- 82% English-only · Spanish 7% Arabic 2% Other Asian/Pacific 2%
Political lean MEDSL · Prince William
- 2024 margin
- D (+18.0) · D 57.6% · R 39.6% · Other 2.8%
- 2008→2024 swing
- +2.1pp toward D · 2008: 15.9pp · 2024: 18.0pp
- All cycles
- 2024: D+18.0 2020: D+27.0 2016: D+20.0 2012: D+16.0 2008: D+15.9
Not yet ingested
- Civics
- —
Market trends
- HPI YoY
- ▼ -0.41%
- Current HPI
- 309.3285
- Rent YoY
- —
- Metro
- Washington-Arlington-Alexandria, DC-VA-MD-WV
- State GDP YoY
- ▲ 2.40%
- F500 in state
- 50
Industry mix (Fortune 500 HQ in VA)
| Industry | F500 HQs | Revenue |
|---|---|---|
| Aerospace / Defense | 4 | $236B |
|
||
| Technology / Defense | 3 | $32B |
|
||
| Financial Services | 2 | $176B |
|
||
| Utilities | 2 | $27B |
|
||
| Insurance | 2 | $25B |
|
||
| Technology | 2 | $15B |
|
||
Price history
+174.5% since first listed7 events — show timeline
- 2026-06-01 Listed $420,000 BRIGHT MLS
- 2007-01-31 Sold (Public Records) $349,900 Public Records
- 2007-01-30 Sold (MLS) $349,900 MRIS
- 2007-01-04 Delisted — MRIS
- 2006-11-25 Listed $349,900 MRIS
- 2003-04-28 Sold (Public Records) $225,000 Public Records
- 2001-02-06 Sold (Public Records) $153,000 Public Records
Property tax history
+2.9%/yrLatest (2025): $4,508 · +9.0% YoY. Source: county tax records.
Cash-flow waterfall
monthlySold comps — $/sqft
last 12 mo · ≤1 miLoading sold comps…