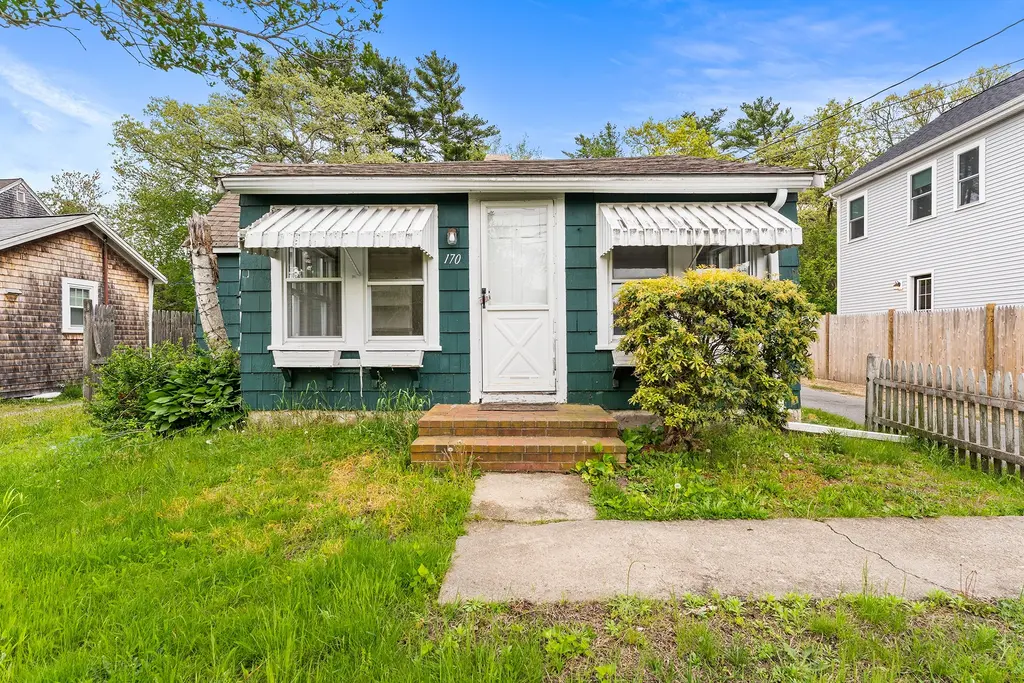
170 Wareham Rd
Marion Center, MA 02738
$299,900C+
3 bd · 1.0 ba ·
898 sqft ·
Built 1946
· SingleFamily
· Active
· 27 DOM
Cashflow @ list (25.0% down · 7.5%)
Estimated rent
$3,049/mo
Mortgage (P&I)
−$1,573
Tax + insurance
−$823
HOA
−$0
Vac / Maint / Mgmt
−$640
Net cashflow
$13/mo
Annual
$159/yr
Cap rate
8.19%
Cash-on-cash
6.77%
DSCR
1.30
1% rule
1.02%
Cash to close
$83,972
Investor read
- This is a 3-bed/1.0-bath single-family listed at $300k.
- At list price, monthly cash flow is $13 ($159/yr) — positive.
- The deal already cash-flows at list — no discount required.
- Meets the 1% rule at list price ($3k rent vs $300k).
- It's been on market 27 days — a 2% lower offer ($295k) is reasonable based on typical stale-listing flexibility.
- Recommended offer: $295k (1.5% below list) — sets the bar for market timing.
- Local home prices are declining (-3.0%/yr); year-one equity from $2k of loan paydown is wiped out by about $9k of value loss. Plan a longer hold.
- Location reads 65/100 on livability (#179 in MA) — a middle-class / working-renter tenant base. Strengths: crime A+, employment A; Watch: housing C-, amenities F, commute F.
- Old Rochester (rural): math 45% / reading 58% proficiency, ranked #105 of 302 in MA (top 35%) — acceptable for families but not a draw, mixed tenant base, ~2y average lease; only 9% free/reduced lunch — higher-income household profile.
- Zoned schools: Sippican (math 44% / reading 57%, grade D+, #319 of 938 statewide, top 34%, 403 students, 0% FRL); Old Rochester Regional Jr High (math 35% / reading 48%, grade F, #133 of 305 statewide, top 45%, 424 students, 0% FRL); Old Rochester Regional High (math 67% / reading 82%, grade B+, #60 of 343 statewide, top 19%, 627 students, 0% FRL).
- Watch-outs: flood insurance adds $460/mo; built in 1946 — expect roof / HVAC / electrical / plumbing capex.
- Market conditions: 30 active listings in the ZIP; 1,255 units permitted in Plymouth County in 2024 (411 in 5+ unit buildings).
- Climate carrying-cost: in FEMA flood zone AE (mandatory federal flood insurance); severe wind risk, 80% chance of damaging wind over 30y; extreme-heat days projected 7→16/yr by 2055 (HVAC capex compounding) — expect insurance premiums to compound above CPI over the hold.
- Cap rate 8.2% vs local median 1.9% in Marion Center — top-decile yield for the area; either an underpriced asset or a hidden risk that comps aren't pricing in. Stress-test before assuming the spread holds.
Questions for listing agent
- Built in 1946 — when were the roof, HVAC, electrical panel, plumbing, and water heater last replaced?
- What's the actual annual flood-insurance premium (NFIP or private), and is the property in a SFHA with mandatory coverage?
- Is there a deadline driving the sale (1031 exchange, divorce, estate, relocation)? That informs how much negotiation room exists.
- Schools are B-rated — typically a magnet for longer-tenancy family renters. What's the average tenant stay here, and is there a school-zone premium baked into asking?
- What's the average days-on-market for RENTAL listings here right now (not sales)? A rising rental-DOM trend means longer vacancies and softer asking-rent achievability than the comps imply.
- What's the recent tenant-quality profile in this submarket — average credit score on applications, eviction rate, late-payment / NSF rate, and stable-employment percentage? A property-management company in the area should have these aggregated.
- How much new for-sale + rental construction is in the pipeline within 1–3 miles? Heavy new supply typically softens prices + rents 12–24 months out; constrained supply supports both.
CashFlowRE · CFR-EBKPVD5K4TWV6K
· Data 2 h ago
cashflowre.app · 2026-05-29