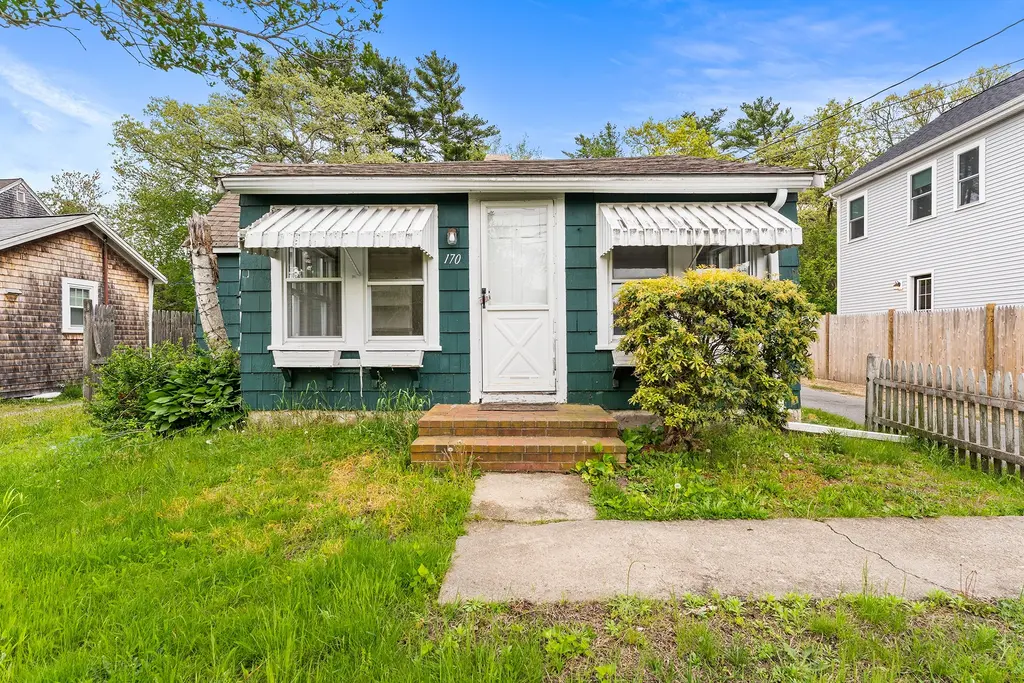
170 Wareham Rd · Marion Center, MA
Flood risk 1/10 · Minimal
- FEMA flood zone
- AE
- Chance of flooding over 30 yrs
- 0.0%
- Est. flood insurance / yr
- $2,026 – $9,024
Fire risk 1/10 · Minimal
- Est. fire insurance / yr
- $915 – $1,699
Heat risk 5/10 · Moderate
- Hot days now (above 93°F)
- 7 days/yr
- Hot days in 30 yrs
- 16 days/yr
Wind risk 8/10 · Major
- Chance of severe wind over 30 yrs
- 80.0%
Air-quality risk 2/10 · Minimal
- Unhealthy air days now
- 1 days/yr
- Unhealthy air days in 30 yrs
- 1 days/yr
Risk factors via First Street. Map © Google.
Why this score? — see what drove the C+ grade
The composite is a weighted blend of 9 inputs, each scored 0–100. Each bar is that input's sub-score; the figure is the points it added to the 100-point composite (weight × sub-score).
- Cash flow +21.9/30.0
- ARV discount +15.0/15.0
- DSCR +7.0/10.0
- 1% rule +5.2/10.0
- Schools +4.7/10.0
- Livability +3.2/5.0
- Rent growth +2.5/5.0
- Condition / age +2.5/5.0
- Appreciation +0.0/10.0
$299,900
🖨 Deal sheet (PDF) 📄 Offer letter ✓ Due diligence
Listing remarks
Investors & contractors, come take a peek at this jewel, ready for it's glow-up. This sweet, three-bedroom, one-bath cottage-style home, needs some TLC but has unlimited potential. The home is located on a nice-sized lot in desirable Marion. Marion’s coastal charm, strong schools, & residential appeal create an exceptional quality of life. This property is located in the Old Rochester District which is well regarded for academics, athletics and art programs. Owner has not lived in the home for many years; buyers to do due diligence. The garage is likely a teardown. Will not pass FHA financing. Great opportunity for those willing to invest with sweat equity!
Key facts
- Coastal charm
- Strong schools
- 9,604 sq ft lot
Tags
Property features AI
Finance
- HOA & community: Community features include park, walk/jog trails, conservation area, highway access, private and public schools; Not a senior community
Exterior
- Parking: Detached covered garage (1 space); Paved off-street parking; 7 open parking spaces (8 total parking spaces)
- Utilities: Public water; Public sewer; Electric with circuit breakers; Gas available for range
- Home design: Single family residence; Public road frontage
- Construction: Frame construction; Shingle roof; Slab foundation; Built according to public records
- Exterior features: Enclosed porch
Interior
- Kitchen: Custom built cabinets; Vinyl flooring; Overhead lighting; Range; Refrigerator
- Bedrooms: Master bedroom on first floor with hardwood flooring and crown molding; Second bedroom on first floor with wall-to-wall carpet and crown molding; Third bedroom on first floor with wall-to-wall carpet and crown molding
- Flooring: Hardwood; Vinyl; Wall-to-wall carpet
- Bathrooms: 1 full bathroom on first floor
- Heating & cooling: Forced air heating; Oil heating
- Interior features: Custom built closet/cabinets; 5 total rooms; Exterior access from living room; Wainscoting; Overhead lighting
- Laundry & utility: Laundry on first floor; Water heater
Neighborhood map
What this means for you Summary
Snapshot
- This is a 3-bed/1.0-bath single-family listed at $300k.
Deal economics
- At list price, monthly cash flow is $13 ($159/yr) — positive.
- The deal already cash-flows at list — no discount required.
- Meets the 1% rule at list price ($3k rent vs $300k).
- Recommended offer: $295k (1.5% below list) — sets the bar for market timing.
- Cap rate 8.2% vs local median 1.9% in Marion Center — top-decile yield for the area; either an underpriced asset or a hidden risk that comps aren't pricing in. Stress-test before assuming the spread holds.
Location & tenants
- Location reads 65/100 on livability (#179 in MA) — a middle-class / working-renter tenant base. Strengths: crime A+, employment A; Watch: housing C-, amenities F, commute F.
- Old Rochester (rural): math 45% / reading 58% proficiency, ranked #105 of 302 in MA (top 35%) — acceptable for families but not a draw, mixed tenant base, ~2y average lease; only 9% free/reduced lunch — higher-income household profile.
- Zoned schools: Sippican (math 44% / reading 57%, grade D+, #319 of 938 statewide, top 34%, 403 students, 0% FRL); Old Rochester Regional Jr High (math 35% / reading 48%, grade F, #133 of 305 statewide, top 45%, 424 students, 0% FRL); Old Rochester Regional High (math 67% / reading 82%, grade B+, #60 of 343 statewide, top 19%, 627 students, 0% FRL).
- Market conditions: 30 active listings in the ZIP; 1,255 units permitted in Plymouth County in 2024 (411 in 5+ unit buildings).
Forward outlook
- Local home prices are declining (-3.0%/yr); year-one equity from $2k of loan paydown is wiped out by about $9k of value loss. Plan a longer hold.
Negotiation context
- It's been on market 27 days — a 2% lower offer ($295k) is reasonable based on typical stale-listing flexibility.
Risks & watch-outs
- Watch-outs: flood insurance adds $460/mo; built in 1946 — expect roof / HVAC / electrical / plumbing capex.
- Climate carrying-cost: in FEMA flood zone AE (mandatory federal flood insurance); severe wind risk, 80% chance of damaging wind over 30y; extreme-heat days projected 7→16/yr by 2055 (HVAC capex compounding) — expect insurance premiums to compound above CPI over the hold.
Questions for the listing agent
- Built in 1946 — when were the roof, HVAC, electrical panel, plumbing, and water heater last replaced?
- What's the actual annual flood-insurance premium (NFIP or private), and is the property in a SFHA with mandatory coverage?
- Is there a deadline driving the sale (1031 exchange, divorce, estate, relocation)? That informs how much negotiation room exists.
- Schools are B-rated — typically a magnet for longer-tenancy family renters. What's the average tenant stay here, and is there a school-zone premium baked into asking?
- What's the average days-on-market for RENTAL listings here right now (not sales)? A rising rental-DOM trend means longer vacancies and softer asking-rent achievability than the comps imply.
- What's the recent tenant-quality profile in this submarket — average credit score on applications, eviction rate, late-payment / NSF rate, and stable-employment percentage? A property-management company in the area should have these aggregated.
- How much new for-sale + rental construction is in the pipeline within 1–3 miles? Heavy new supply typically softens prices + rents 12–24 months out; constrained supply supports both.
Investment metrics
- 1% rule
- 1.02% ✓
- Cap rate
- 8.19%
- Cash-on-cash
- 6.77%
- DSCR
- 1.30
- GRM
- 8.2
CMA / ARV
- ARV (on-the-fly)
- $508,268
- Comps found
- 2
Show comp detail 2 sales within ~0.75 mi
| Address | Dist | Beds/Ba | Sqft | Sold | Price | $/sf | Match |
|---|---|---|---|---|---|---|---|
| 5 Hermitage Rd | 0.70mi | 3/1.0 | 1,016 (+13%) | 2mo | $575,000 | $566 | 44 |
| 548 Delano Rd | 0.51mi | 3/1.0 | 1,018 (+13%) | 13mo | $382,000 | $375 | 43 |
Match score weights: distance 35% · size 25% · config 20% · recency 20%. Top-matched comps best support the ARV.
Projected returns pro-forma
-3.0% appreciation · 3.0% rent growth · sell at horizon
- IRR
- -15.9%
- Equity multiple
- 0.43×
- Total profit
- $-47,509
- Equity at exit
- $44,716
- IRR
- -7.4%
- Equity multiple
- 0.53×
- Total profit
- $-39,290
- Equity at exit
- $25,930
Cash invested: $83,972 (down + closing). Projections, not guarantees.
Landlord ↔ Tenant lean methodology
- Overall (STATE)
- 20 Strongly Tenant-Friendly
- State Massachusetts
- 20 Strongly Tenant-Friendly · D+15
- County
- — inherits STATE
- City
- — inherits STATE
ZIP-level market 02738
- Home prices YoY
- -14.7%
- Active inventory
- 30
- Price-to-rent
- 8.2×
Monthly cashflow live
- Estimated rent
- $3,049 medium interval (Pro) →
- Mortgage (P&I)
- −$1,573
- Tax from tax record
- −$238 /mo · $2,853/yr
- Insurance
- −$125
- Flood insurance flood zone
- −$460 /mo · $5,525/yr
- HOA
- −$0
- Vacancy / Maint / Mgmt
- −$640
- Net cashflow
- $13
Break-even live
Sensitivity live
| Price | -10% $183 | -5% $98 | +0% $13 | +5% $-72 | +10% $-157 |
|---|---|---|---|---|---|
| Rent | -10% $-228 | -5% $-107 | +0% $13 | +5% $134 | +10% $254 |
| Rate | -1.0pp $164 | -0.5pp $90 | base $13 | +0.5pp $-64 | +1.0pp $-144 |
UW: 25.0% down · 7.5% · 30yr · 1.5% tax · 5.0% vac · 8.0% maint · 8.0% mgmt
Financing live
Cash to close
- Down payment
- $74,975
- Closing costs
- $8,997
- Reserves months
- —
- Total cash needed
- —
Loan-product check · same deal, 3 products live
Conventional
25% down · 7.5% · 30yr
- Down + closing
- —
- Monthly P&I
- —
- Monthly cashflow
- —
- DSCR
- —
- Eligible?
- —
Personal DTI + credit; lowest rate.
DSCR
20% down · 8.5% · 30yr
- Down + closing
- —
- Monthly P&I
- —
- Monthly cashflow
- —
- DSCR
- —
- Eligible?
- —
No personal income docs; deal must DSCR.
Hard money
10% down · 12.0% · 12mo
- Down + closing
- —
- Monthly P&I
- —
- Monthly cashflow
- —
- DSCR
- —
- Eligible?
- —
Short-term bridge; refi at stabilization.
Listing history 19 events
-
2026-06-22days on market $299,900 Active 27 DOM
-
2026-06-21days on market $299,900 Active 26 DOM
-
2026-06-21days on market $299,900 Active 25 DOM
-
2026-06-18days on market $299,900 Active 23 DOM
-
2026-06-17days on market $299,900 Active 22 DOM
-
2026-06-16days on market $299,900 Active 21 DOM
-
2026-06-15days on market $299,900 Active 20 DOM
-
2026-06-13days on market $299,900 Active 18 DOM
-
2026-06-12days on market $299,900 Active 17 DOM
-
2026-06-09days on market $299,900 Active 14 DOM
-
2026-06-08days on market $299,900 Active 13 DOM
-
2026-06-07days on market $299,900 Active 12 DOM
-
2026-06-05days on market $299,900 Active 10 DOM
-
2026-06-04days on market $299,900 Active 9 DOM
-
2026-06-03days on market $299,900 Active 8 DOM
-
2026-06-02days on market $299,900 Active 7 DOM
-
2026-06-01days on market $299,900 Active 6 DOM
-
2026-05-31days on market $299,900 Active 5 DOM
-
2026-05-26$299,900 New
ⓘ Source: listings_history table (triggers on properties + properties_extension) + one-shot
backfill from property_details.listing_events for pre-trigger history.
Tax reassessment forecast MA · Partial reset (capped growth)
- Current annual tax
- $2,853 · $238/mo
- Projected year-2 tax
- $3,271 · $273/mo
- Expected delta
- +$418/yr (+$35/mo · 14.6%)
ⓘ Screening estimate from a state-policy table — verify with the county assessor before closing.
Climate risk First Street
- Flood 1/10 Low FEMA zone AE · 0% chance over 30 yrs
- Wildfire 1/10 Low
- Heat 5/10 Major 7 d/yr ≥93°F today · 16 d/yr by 30 yrs out
- Wind 8/10 Severe 80% chance of damaging wind over 30 yrs
- Air quality 2/10 Low 1 unhealthy d/yr today · 1 by 30 yrs out
Nearby sold comps map
Loading sold comps map…
Walkable amenities ~0.75 mi
Loading nearby amenities…
Taxation est. · year 1
- Rental income
- $36,594
- − Mortgage interest
- −$16,799
- − Property taxes
- −$2,853
- − Insurance
- −$7,024
- − Repairs & maintenance
- −$2,927
- − Management
- −$2,927
- − Depreciation
- −$8,724
- Taxable loss
- −$4,662
- Est. tax savings @ 24.0%
- +$1,119
- After-tax cash flow
- $1,278/yr
For passive investors: Depreciation is non-cash, so a rental often shows a tax loss while cash-flowing — sheltering income. Rental losses are passive: they offset passive income freely, and up to $25,000/yr can offset ordinary (W-2) income if you actively participate and your MAGI is under $100k (phasing out to $0 by $150k); unused losses carry forward. On sale, claimed depreciation is recaptured at up to 25%, and gains may owe capital-gains tax (a 1031 exchange can defer both). Figures are a year-1 estimate at your 24.0% rate — not tax advice; consult a CPA.
Schools (NCES district)
- District
- Old Rochester
- NCES district ID
- 2509150
- Math proficiency
- 45% ▼ -21.00%
- Reading proficiency
- 58% ▼ -18.00%
- Median HH income
- $79,903
- Composite
- 46.84/100
- National rank
- #2375
- State rank
- #105 of 302 in MA
Livability — Marion Center
- Score
- 65/100
- State rank
- #179
- US rank
- #12465
Category grades
Schools grade is shown separately in the Schools card above.
Census & demographics
- Population (ZIP)
- 5,312
Population outlook (Plymouth County) Hauer SSP2
- Today (2025)
- 533,105 people
- By 2030
- 541,862 · +1.6%
- By 2040
- 549,791 · +3.1%
- By 2050
- 542,476 · +1.8%
- By 2075
- 518,429 · -2.8%
- By 2100
- 448,179 · -15.9%
Race, ethnicity, and origin ACS 2023
- Neighborhood character
- Predominantly White (81%)
- Race & ethnicity
- White 81% Two or more races 9% Black 4% Hispanic / Latino 3% Asian 1%
- Common ancestry
- Russian 11% Lithuanian 4% Slovak 2%
- Foreign-born
- 5% · Canada, China
- Languages at home
- 94% English-only · French/Haitian/Cajun 2% Other Indo-European 1% Spanish 1%
Political lean MEDSL · Plymouth
- 2024 margin
- Lean D (+8.8) · D 53.6% · R 44.7% · Other 1.7%
- 2008→2024 swing
- +1.3pp toward D · 2008: 7.6pp · 2024: 8.8pp
- All cycles
- 2024: D+8.8 2020: D+17.4 2016: D+7.2 2012: D+3.8 2008: D+7.6
Not yet ingested
- Civics
- —
Market trends
- HPI YoY
- ▼ -53.42%
- Current HPI
- 309.9871
- Rent YoY
- —
- Metro
- —
- State GDP YoY
- ▲ 2.28%
- F500 in state
- 38
Industry mix (Fortune 500 HQ in MA)
| Industry | F500 HQs | Revenue |
|---|---|---|
| Technology | 3 | $17B |
|
||
| Insurance | 2 | $84B |
|
||
| Retail | 2 | $76B |
|
||
| Life Sciences | 1 | $43B |
|
||
| Energy Technology | 1 | $31B |
|
||
| Aerospace / Defense | 1 | $18B |
|
||
Price history
1 event — show timeline
- 2026-05-26 Listed $299,900 MLS PIN
Property tax history
+3.8%/yrLatest (2025): $2,853 · -3.4% YoY. Source: county tax records.
Cash-flow waterfall
monthlySold comps — $/sqft
last 12 mo · ≤1 miLoading sold comps…