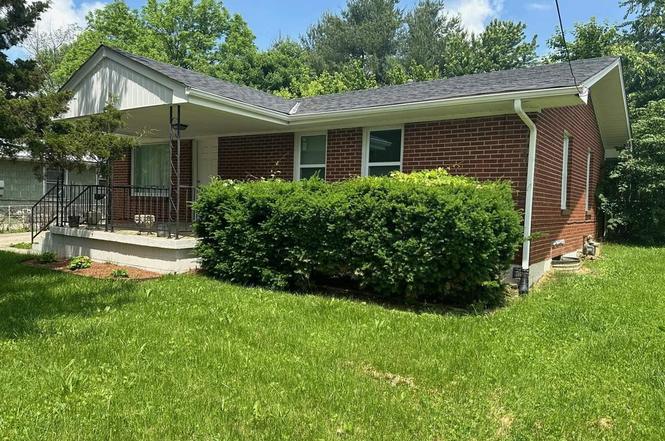
332 Old Cardinal Dr
Elizabethtown, KY 42701
$200,000F
3 bd · 1.5 ba ·
988 sqft ·
Built 1961
· SingleFamily
· Active
· 332 DOM
Cashflow @ list (25.0% down · 7.5%)
Estimated rent
$1,556/mo
Mortgage (P&I)
−$1,049
Tax + insurance
−$246
HOA
−$0
Vac / Maint / Mgmt
−$327
Net cashflow
$-65/mo
Annual
$-786/yr
Cap rate
5.90%
Cash-on-cash
-1.40%
DSCR
0.94
1% rule
0.78%
Cash to close
$56,000
Investor read
- This is a 3-bed/1.5-bath single-family listed at $200k.
- At list price, monthly cash flow is $-65 ($-786/yr) — negative.
- To cash-flow at today's rent, offer at most $188k (5.8% below list).
- To meet the 1% rule (rent ≥ 1% of price), the offer needs to be $156k (22.2% below list).
- It's been on market 332 days — a 12% lower offer ($176k) is reasonable based on typical stale-listing flexibility.
- Recommended offer: $156k (22.2% below list) — sets the bar for 1% rule.
- Local home prices are declining (-3.0%/yr); year-one equity from $1k of loan paydown is wiped out by about $6k of value loss. Plan a longer hold.
- Location reads 72/100 on livability (#131 in KY) — a middle-class / working-renter tenant base. Strengths: crime A+, cost of living A+, housing A; Watch: employment D, amenities F, commute F.
- Elizabethtown Independent (urban): math 26% / reading 45% proficiency, ranked #66 of 165 in KY (top 40%) — families likely to look elsewhere, expect single-tenant / working-renter base with shorter leases.
- Market conditions: Rents rising (+3.3%/yr); 539 active listings in the ZIP; 946 units permitted in Hardin County in 2024 (464 in 5+ unit buildings).
- Hardin County population projected at -16% by 2050 — secular population decline; favor cash flow + early exit over multi-decade hold.
- 14 sale attempts since 5y ago with the ask held roughly flat each time — persistent listings suggest the price (not the market) is what's stuck; bring a comps-based counter.
- Current owner paid $155k; 29% above their basis — modest negotiation headroom, anchor on the comps not their cost.
- Climate carrying-cost: extreme-heat days projected 7→19/yr by 2055 (HVAC capex compounding) — expect insurance premiums to compound above CPI over the hold.
- Cap rate 5.9% vs local median 3.4% in Elizabethtown — top-decile yield for the area; either an underpriced asset or a hidden risk that comps aren't pricing in. Stress-test before assuming the spread holds.
Questions for listing agent
- What do current leases actually rent for vs. the listed asking? Can we see a recent rent roll and the last 12 months of T-12 income?
- It's been on market 332 days. Have you received any prior offers? Is the seller open to a 22% concession, seller financing, or rate buy-down credit?
- Built in 1961 — when were the roof, HVAC, electrical panel, plumbing, and water heater last replaced?
- Why hasn't it sold? Are there any deal-killer items the seller is aware of (foundation, flood, title, zoning, code violations)?
- Is there a deadline driving the sale (1031 exchange, divorce, estate, relocation)? That informs how much negotiation room exists.
- The area grade is low — what's the realistic commute time and amenity access for the typical tenant pool here? Any planned neighborhood developments (good or bad) we should know about?
- What's the average days-on-market for RENTAL listings here right now (not sales)? A rising rental-DOM trend means longer vacancies and softer asking-rent achievability than the comps imply.
- What's the recent tenant-quality profile in this submarket — average credit score on applications, eviction rate, late-payment / NSF rate, and stable-employment percentage? A property-management company in the area should have these aggregated.
CashFlowRE · CFR-EBQRAZ5149D01D
· Data 1 day ago
cashflowre.app · 2026-05-29