332 Old Cardinal Dr · Elizabethtown, KY
Flood risk 1/10 · Minimal
- FEMA flood zone
- X (unshaded)
- Chance of flooding over 30 yrs
- 0.0%
- Est. flood insurance / yr
- $473 – $860
Fire risk 2/10 · Minimal
- Est. fire insurance / yr
- $839 – $1,559
Heat risk 5/10 · Moderate
- Hot days now (above 104°F)
- 7 days/yr
- Hot days in 30 yrs
- 19 days/yr
Wind risk 2/10 · Minimal
- Chance of severe wind over 30 yrs
- 2.0%
Air-quality risk 1/10 · Minimal
- Unhealthy air days now
- 0 days/yr
- Unhealthy air days in 30 yrs
- 0 days/yr
Risk factors via First Street. Map © Google.
Why this score? — see what drove the F grade
The composite is a weighted blend of 9 inputs, each scored 0–100. Each bar is that input's sub-score; the figure is the points it added to the 100-point composite (weight × sub-score).
- Cash flow +11.5/30.0
- Livability +3.6/5.0
- DSCR +3.4/10.0
- Rent growth +3.3/5.0
- Schools +2.9/10.0
- 1% rule +2.8/10.0
- Condition / age +2.5/5.0
- ARV discount +0.0/15.0
- Appreciation +0.0/10.0
$200,000
🖨 Deal sheet 📄 Offer letter ✓ Due diligence
Listing remarks MLS
Completely remodeled home in Elizabethtown Independent School District. We started with a new roof worked our way down to the newly carpeted basement. This Home has 1648 square feet of total living space on nearly a 1/4 acre oversize lot. New appliances. New countertops. New Windows. New Paint. Hardwood Floors. We even added more closet space, and who doesn't want more closet space! If you call me today, you won't have to stand in line to tour this one.
Key facts
- Minutes to blue oval
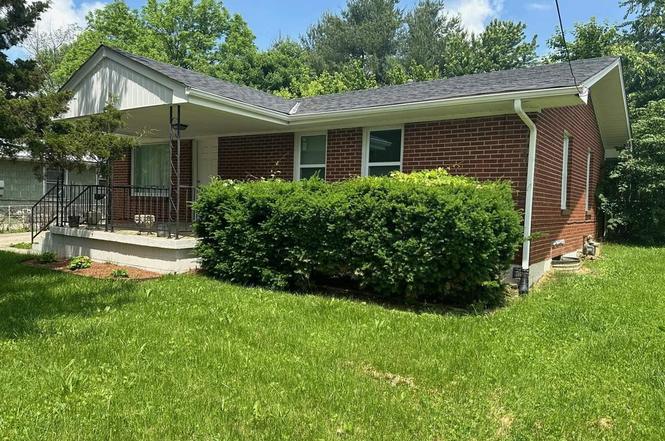
- Brick ranch
- 9,148 sq ft lot
Tags
Property features AI
Exterior
- Security: Accessible full bath
- Utilities: Public water; Public sewer
- Home design: Single-family residence; Residential property; Located in Forest Hill subdivision
- Construction: Brick construction; Shingle roof; Below-grade finished area present
- Exterior features: Covered patio; Porch
Interior
- Kitchen: Range; Oven; Refrigerator
- Flooring: Carpet; Hardwood; Tile
- Bathrooms: 2 full bathrooms; 1 main-level bathroom
- Heating & cooling: Central air; Ceiling fans; Forced air heating; Natural gas heating
- Interior features: Eat-in kitchen; Partially finished, full basement
- Laundry & utility: Laundry room; Gas water heater
Neighborhood map
What this means for you Summary
Snapshot
- This is a 3-bed/1.5-bath single-family listed at $200k.
Deal economics
- At list price, monthly cash flow is $-65 ($-786/yr) — negative.
- To cash-flow at today's rent, offer at most $188k (5.8% below list).
- To meet the 1% rule (rent ≥ 1% of price), the offer needs to be $156k (22.2% below list).
- Recommended offer: $156k (22.2% below list) — sets the bar for 1% rule.
- Cap rate 5.9% vs local median 3.4% in Elizabethtown — top-decile yield for the area; either an underpriced asset or a hidden risk that comps aren't pricing in. Stress-test before assuming the spread holds.
Location & tenants
- Location reads 72/100 on livability (#131 in KY) — a middle-class / working-renter tenant base. Strengths: crime A+, cost of living A+, housing A; Watch: employment D, amenities F, commute F.
- Elizabethtown Independent (urban): math 26% / reading 45% proficiency, ranked #66 of 165 in KY (top 40%) — families likely to look elsewhere, expect single-tenant / working-renter base with shorter leases.
- Market conditions: Rents rising (+3.3%/yr); 539 active listings in the ZIP; 946 units permitted in Hardin County in 2024 (464 in 5+ unit buildings).
Forward outlook
- Local home prices are declining (-3.0%/yr); year-one equity from $1k of loan paydown is wiped out by about $6k of value loss. Plan a longer hold.
- Hardin County population projected at -16% by 2050 — secular population decline; favor cash flow + early exit over multi-decade hold.
Negotiation context
- It's been on market 332 days — a 12% lower offer ($176k) is reasonable based on typical stale-listing flexibility.
- 14 sale attempts since 5y ago with the ask held roughly flat each time — persistent listings suggest the price (not the market) is what's stuck; bring a comps-based counter.
- Current owner paid $155k; 29% above their basis — modest negotiation headroom, anchor on the comps not their cost.
Risks & watch-outs
- Climate carrying-cost: extreme-heat days projected 7→19/yr by 2055 (HVAC capex compounding) — expect insurance premiums to compound above CPI over the hold.
Questions for the listing agent
- What do current leases actually rent for vs. the listed asking? Can we see a recent rent roll and the last 12 months of T-12 income?
- It's been on market 332 days. Have you received any prior offers? Is the seller open to a 22% concession, seller financing, or rate buy-down credit?
- Built in 1961 — when were the roof, HVAC, electrical panel, plumbing, and water heater last replaced?
- Why hasn't it sold? Are there any deal-killer items the seller is aware of (foundation, flood, title, zoning, code violations)?
- Is there a deadline driving the sale (1031 exchange, divorce, estate, relocation)? That informs how much negotiation room exists.
- The area grade is low — what's the realistic commute time and amenity access for the typical tenant pool here? Any planned neighborhood developments (good or bad) we should know about?
- What's the average days-on-market for RENTAL listings here right now (not sales)? A rising rental-DOM trend means longer vacancies and softer asking-rent achievability than the comps imply.
- What's the recent tenant-quality profile in this submarket — average credit score on applications, eviction rate, late-payment / NSF rate, and stable-employment percentage? A property-management company in the area should have these aggregated.
- How much new for-sale + rental construction is in the pipeline within 1–3 miles? Heavy new supply typically softens prices + rents 12–24 months out; constrained supply supports both.
Investment metrics
- 1% rule
- 0.78% ✗
- Cap rate
- 5.90%
- Cash-on-cash
- -1.40%
- DSCR
- 0.94
- GRM
- 10.7
CMA / ARV
- ARV (on-the-fly)
- $152,152
- Comps found
- 1
Show comp detail 1 sale within ~0.75 mi
| Address | Dist | Beds/Ba | Sqft | Sold | Price | $/sf | Match |
|---|---|---|---|---|---|---|---|
| 1206 Woodland Dr | 0.43mi | 3/1.0 | 875 (-11%) | 2mo | $135,000 | $154 | 58 |
Match score weights: distance 35% · size 25% · config 20% · recency 20%. Top-matched comps best support the ARV.
Projected returns pro-forma
-3.0% appreciation · 3.32% rent growth · sell at horizon
- IRR
- -18.3%
- Equity multiple
- 0.36×
- Total profit
- $-36,107
- Equity at exit
- $29,821
- IRR
- -10.1%
- Equity multiple
- 0.38×
- Total profit
- $-34,858
- Equity at exit
- $17,292
Cash invested: $56,000 (down + closing). Projections, not guarantees.
Landlord ↔ Tenant lean methodology
- Overall (STATE)
- 83 Strongly Landlord-Friendly
- State Kentucky
- 83 Strongly Landlord-Friendly · R+16
- County
- — inherits STATE
- City
- — inherits STATE
ZIP-level market 42701
- Home prices YoY
- -29.8%
- Rents YoY
- 3.3%
- Active inventory
- 539
- Price-to-rent
- 10.7×
Monthly cashflow live
- Estimated rent
- $1,556 medium interval (Pro) →
- Mortgage (P&I)
- −$1,049
- Tax from tax record
- −$163 /mo · $1,955/yr
- Insurance
- −$83
- HOA
- −$0
- Vacancy / Maint / Mgmt
- −$327
- Net cashflow
- $-65
Break-even live
UW: 25.0% down · 7.5% · 30yr · 1.5% tax · 5.0% vac · 8.0% maint · 8.0% mgmt
Financing live
Cash to close
- Down payment
- $50,000
- Closing costs
- $6,000
- Reserves months
- —
- Total cash needed
- —
Loan-product check · same deal, 3 products live
Conventional
25% down · 7.5% · 30yr
- Down + closing
- —
- Monthly P&I
- —
- Monthly cashflow
- —
- DSCR
- —
- Eligible?
- —
Personal DTI + credit; lowest rate.
DSCR
20% down · 8.5% · 30yr
- Down + closing
- —
- Monthly P&I
- —
- Monthly cashflow
- —
- DSCR
- —
- Eligible?
- —
No personal income docs; deal must DSCR.
Hard money
10% down · 12.0% · 12mo
- Down + closing
- —
- Monthly P&I
- —
- Monthly cashflow
- —
- DSCR
- —
- Eligible?
- —
Short-term bridge; refi at stabilization.
Listing history 44 events
-
2026-06-19days on market $200,000 Active 332 DOM
-
2026-06-18days on market $200,000 Active 331 DOM
-
2026-06-17days on market $200,000 Active 330 DOM
-
2026-06-16days on market $200,000 Active 329 DOM
-
2026-06-15days on market $200,000 Active 328 DOM
-
2026-06-14days on market $200,000 Active 326 DOM
-
2026-06-13days on market $200,000 Active 325 DOM
-
2026-06-10days on market $200,000 Active 323 DOM
-
2026-06-09days on market $200,000 Active 322 DOM
-
2026-06-08days on market $200,000 Active 321 DOM
-
2026-06-07days on market $200,000 Active 320 DOM
-
2026-06-05days on market $200,000 Active 317 DOM
-
2026-06-02days on market $200,000 Active 315 DOM
-
2026-06-01days on market $200,000 Active 314 DOM
-
2026-05-31days on market $200,000 Active 313 DOM
-
2026-05-30days on market $200,000 Active 312 DOM
-
2026-05-11price $200,000
-
2026-05-10status Active
-
2026-04-18status Pending
-
2026-04-15status Active
-
2026-04-14historical
-
2026-04-11status Active
-
2026-04-10historical
-
2026-04-02status Active
-
2026-03-28status Active
-
2026-03-23status Active
-
2026-03-15status Active
-
2026-03-14historical
-
2026-02-15status Active
-
2026-02-15historical
-
2026-01-31status Active
-
2026-01-31historical
-
2026-01-09status Active
-
2026-01-09historical
-
2026-01-05status Active
-
2026-01-04historical
-
2025-12-31status Active
-
2025-12-30historical
-
2025-06-30$205,000 Active
-
2021-07-08soldstatus $154,900
-
2021-07-07soldstatus $154,900 457-char remark
Show marketing remark (457 chars)
Completely remodeled home in Elizabethtown Independent School District. We started with a new roof worked our way down to the newly carpeted basement. This Home has 1648 square feet of total living space on nearly a 1/4 acre oversize lot. New appliances. New countertops. New Windows. New Paint. Hardwood Floors. We even added more closet space, and who doesn't want more closet space! If you call me today, you won't have to stand in line to tour this one.
-
2021-04-28$154,900 457-char remark
Show marketing remark (457 chars)
Completely remodeled home in Elizabethtown Independent School District. We started with a new roof worked our way down to the newly carpeted basement. This Home has 1648 square feet of total living space on nearly a 1/4 acre oversize lot. New appliances. New countertops. New Windows. New Paint. Hardwood Floors. We even added more closet space, and who doesn't want more closet space! If you call me today, you won't have to stand in line to tour this one.
-
2020-04-29soldstatus $86,000
-
2009-03-11soldstatus $85,000
ⓘ Source: listings_history table (triggers on properties + properties_extension) + one-shot
backfill from property_details.listing_events for pre-trigger history.
Tax reassessment forecast KY · Resets to sale price
- Current annual tax
- $1,955 · $163/mo
- Projected year-2 tax
- $1,955 · $163/mo
- Expected delta
- $0/yr ($0/mo · 0.0%)
ⓘ Screening estimate from a state-policy table — verify with the county assessor before closing.
Climate risk First Street
- Flood 1/10 Low FEMA zone X (unshaded) · 0% chance over 30 yrs
- Wildfire 2/10 Low
- Heat 5/10 Major 7 d/yr ≥104°F today · 19 d/yr by 30 yrs out
- Wind 2/10 Low 2% chance of damaging wind over 30 yrs
- Air quality 1/10 Low 0 unhealthy d/yr today · 0 by 30 yrs out
Nearby sold comps map
Loading sold comps map…
Walkable amenities ~0.75 mi
Loading nearby amenities…
Taxation est. · year 1
- Rental income
- $18,678
- − Mortgage interest
- −$11,203
- − Property taxes
- −$1,955
- − Insurance
- −$1,000
- − Repairs & maintenance
- −$1,494
- − Management
- −$1,494
- − Depreciation
- −$5,818
- Taxable loss
- −$4,287
- Est. tax savings @ 24.0%
- +$1,029
- After-tax cash flow
- $243/yr
For passive investors: Depreciation is non-cash, so a rental often shows a tax loss while cash-flowing — sheltering income. Rental losses are passive: they offset passive income freely, and up to $25,000/yr can offset ordinary (W-2) income if you actively participate and your MAGI is under $100k (phasing out to $0 by $150k); unused losses carry forward. On sale, claimed depreciation is recaptured at up to 25%, and gains may owe capital-gains tax (a 1031 exchange can defer both). Figures are a year-1 estimate at your 24.0% rate — not tax advice; consult a CPA.
Schools (NCES district)
- District
- Elizabethtown Independent
- NCES district ID
- 2101650
- Math proficiency
- 26% ▼ -25.00%
- Reading proficiency
- 45% ▼ -17.00%
- Median HH income
- $36,400
- Composite
- 29.39/100
- National rank
- #6526
- State rank
- #66 of 165 in KY
Livability — Elizabethtown
- Score
- 72/100
- State rank
- #131
- US rank
- #6198
Category grades
Schools grade is shown separately in the Schools card above.
Census & demographics
- Census place
- Elizabethtown, KY
- County
- Hardin County · 77,611 people
- City population
- 53,987
- Metro
- Elizabethtown-Fort Knox, KY
- Population (ZIP)
- 53,987
- Household income
- $69,619
- Rent vs Own
- Severe rent burden
- 1663.0
Population outlook (Hardin County) Hauer SSP2
- Today (2025)
- 105,573 people
- By 2030
- 103,563 · -1.9%
- By 2040
- 97,077 · -8.0%
- By 2050
- 88,367 · -16.3%
- By 2075
- 65,405 · -38.0%
- By 2100
- 42,245 · -60.0%
Race, ethnicity, and origin ACS 2023
- Neighborhood character
- Predominantly White (79%)
- Race & ethnicity
- White 79% Black 9% Two or more races 6% Hispanic / Latino 5% Asian 2%
- Hispanic origin (detail)
- Mexican 3% Puerto Rican 1%
- Common ancestry
- Italian 3% Slovak 2% Romanian 2%
- Foreign-born
- 4% · Canada, South Korea
- Languages at home
- 94% English-only · Spanish 3% German/W. Germanic 1% Other Indo-European 1%
Political lean MEDSL · Hardin
- 2024 margin
- Strong R (+29.3) · D 34.5% · R 63.8% · Other 1.7%
- 2008→2024 swing
- -8.7pp toward R · 2008: -20.6pp · 2024: -29.3pp
- All cycles
- 2024: R+29.3 2020: R+24.0 2016: R+30.2 2012: R+20.8 2008: R+20.6
Not yet ingested
- Civics
- —
Market trends
- HPI YoY
- ▼ -96.94%
- Current HPI
- 228.7091
- Rent YoY
- ▲ 3.32%
- Metro
- Elizabethtown-Fort Knox, KY
- State GDP YoY
- ▲ 1.81%
- F500 in state
- 4
Industry mix (Fortune 500 HQ in KY)
| Industry | F500 HQs | Revenue |
|---|---|---|
| Healthcare | 1 | $118B |
|
||
| Food / Beverage | 1 | $7B |
|
||
Price history
+135.3% since first listed28 events — show timeline
- 2026-05-11 Price Changed $200,000 HKARMLS
- 2026-05-10 Relisted — HKARMLS
- 2026-04-18 Pending — HKARMLS
- 2026-04-15 Relisted — HKARMLS
- 2026-04-14 Delisted — HKARMLS
- 2026-04-11 Relisted — HKARMLS
- 2026-04-10 Delisted — HKARMLS
- 2026-04-02 Relisted — HKARMLS
- 2026-03-28 Relisted — HKARMLS
- 2026-03-23 Relisted — HKARMLS
- 2026-03-15 Relisted — HKARMLS
- 2026-03-14 Delisted — HKARMLS
- 2026-02-15 Relisted — HKARMLS
- 2026-02-15 Delisted — HKARMLS
- 2026-01-31 Relisted — HKARMLS
- 2026-01-31 Delisted — HKARMLS
- 2026-01-09 Relisted — HKARMLS
- 2026-01-09 Delisted — HKARMLS
- 2026-01-05 Relisted — HKARMLS
- 2026-01-04 Delisted — HKARMLS
- 2025-12-31 Relisted — HKARMLS
- 2025-12-30 Delisted — HKARMLS
- 2025-06-30 Listed $205,000 HKARMLS
- 2021-07-08 Sold (Public Records) $154,900 Public Records
- 2021-07-07 Sold (MLS) $154,900 HKARMLS
- 2021-04-28 Listed $154,900 HKARMLS
- 2020-04-29 Sold (Public Records) $86,000 Public Records
- 2009-03-11 Sold (Public Records) $85,000 Public Records
Property tax history
+8.0%/yrLatest (2025): $1,955 · +1.1% YoY. Source: county tax records.
Cash-flow waterfall
monthlySold comps — $/sqft
last 12 mo · ≤1 miLoading sold comps…