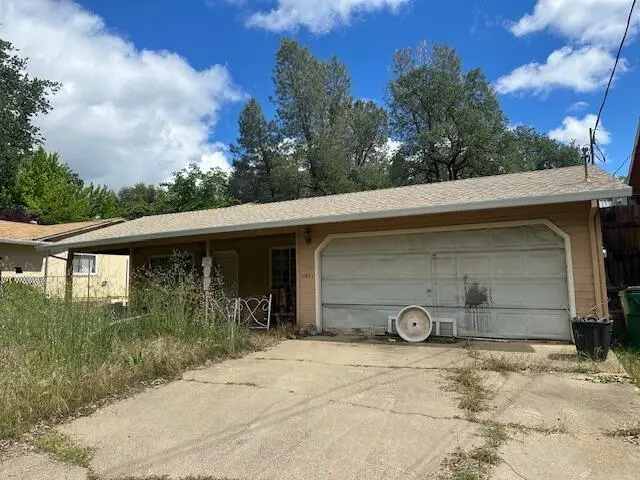
1911 Oregon Ave
Shasta Lake, CA 96019
$150,000C+
3 bd · 2.0 ba ·
1,196 sqft ·
Built 1991
· SingleFamily
· Pending
Cashflow @ list (25.0% down · 7.5%)
Estimated rent
$1,780/mo
Mortgage (P&I)
−$787
Tax + insurance
−$395
HOA
−$0
Vac / Maint / Mgmt
−$374
Net cashflow
$224/mo
Annual
$2,693/yr
Cap rate
8.62%
Cash-on-cash
8.31%
DSCR
1.37
1% rule
1.19%
Cash to close
$42,000
Investor read
- This is a 3-bed/2.0-bath single-family listed at $150k.
- At list price, monthly cash flow is $224 ($3k/yr) — positive.
- The deal already cash-flows at list — no discount required.
- Meets the 1% rule at list price ($2k rent vs $150k).
- Only 0 days on market — expect competitive offers; lowballing is unlikely to land.
- Local home prices are declining (-3.0%/yr); year-one equity from $1k of loan paydown is wiped out by about $4k of value loss. Plan a longer hold.
- Location reads 65/100 on livability (#399 in CA) — a middle-class / working-renter tenant base. Strengths: housing A+, health & safety A+, commute A; Watch: employment C-, crime F, amenities F.
- Gateway Unified (suburban): math 25% / reading 35% proficiency, ranked #355 of 517 in CA (top 69%) — families likely to look elsewhere, expect single-tenant / working-renter base with shorter leases.
- Zoned schools: Shasta Lake (math 27% / reading 36%, grade F, #816 of 1,571 statewide, top 52%, 616 students, 74% FRL); Central Valley High (math 42% / reading 67%, grade C-, #256 of 1,170 statewide, top 24%, 625 students, 60% FRL).
- Zoned-school proficiency averages 43% at this address vs 30% district-wide (+13 pts) — the actual schools serving this property are materially stronger than the Gateway Unified average implies; a family-tenant draw the district grade alone would hide.
- Watch-outs: flood insurance adds $66/mo.
- Market conditions: 96 active listings in the ZIP; 4 comparable units currently listed for rent nearby; rentals at typical pace (median 16d on market — plan ~3-4 weeks tenant-placement turnaround); 246 units permitted in Shasta County in 2024 (0 in 5+ unit buildings).
- Shasta County population projected to shrink 9% by 2050 — rents likely to lag national; underwrite the cash flow, not the appreciation.
- Climate carrying-cost: major flood risk; severe wildfire risk; extreme-heat days projected 7→17/yr by 2055 (HVAC capex compounding) — expect insurance premiums to compound above CPI over the hold.
- Cap rate 8.6% vs local median 3.7% in Shasta Lake — top-decile yield for the area; either an underpriced asset or a hidden risk that comps aren't pricing in. Stress-test before assuming the spread holds.
- This rent runs 32% of the median local income ($67k/yr) — at the standard rent-burdened threshold; future hikes will face affordability resistance.
Questions for listing agent
- What's the actual annual flood-insurance premium (NFIP or private), and is the property in a SFHA with mandatory coverage?
- Is there a deadline driving the sale (1031 exchange, divorce, estate, relocation)? That informs how much negotiation room exists.
- Schools are D-rated, which usually means shorter tenancies and higher turnover. Who's the typical renter profile here, and what's been the actual vacancy rate?
- Crime grade is F in this area — have there been break-ins, vandalism, or insurance claims at this property in the last 3 years? What carrier currently insures it and at what premium?
- What's the average days-on-market for RENTAL listings here right now (not sales)? A rising rental-DOM trend means longer vacancies and softer asking-rent achievability than the comps imply.
- What's the recent tenant-quality profile in this submarket — average credit score on applications, eviction rate, late-payment / NSF rate, and stable-employment percentage? A property-management company in the area should have these aggregated.
- How much new for-sale + rental construction is in the pipeline within 1–3 miles? Heavy new supply typically softens prices + rents 12–24 months out; constrained supply supports both.
CashFlowRE · CFR-EDJA7WEB8HA5QA
· Data 4 weeks ago
cashflowre.app · 2026-05-29