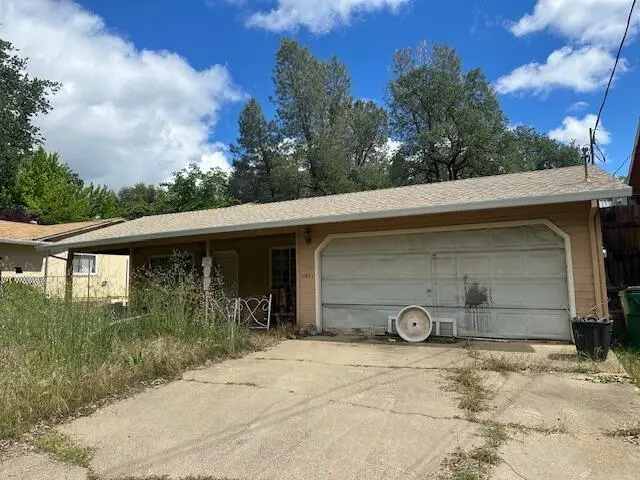
1911 Oregon Ave · Shasta Lake, CA
Flood risk 7/10 · Major
- FEMA flood zone
- X (unshaded)
- Chance of flooding over 30 yrs
- 0.6%
- Est. flood insurance / yr
- $507 – $1,088
Fire risk 8/10 · Major
- Est. fire insurance / yr
- $659 – $1,223
Heat risk 8/10 · Major
- Hot days now (above 105°F)
- 7 days/yr
- Hot days in 30 yrs
- 17 days/yr
Wind risk 1/10 · Minimal
- Chance of severe wind over 30 yrs
- —
Air-quality risk 10/10 · Severe
- Unhealthy air days now
- 44 days/yr
- Unhealthy air days in 30 yrs
- 46 days/yr
Risk factors via First Street. Map © Google.
Why this score? — see what drove the C+ grade
The composite is a weighted blend of 9 inputs, each scored 0–100. Each bar is that input's sub-score; the figure is the points it added to the 100-point composite (weight × sub-score).
- Cash flow +23.9/30.0
- ARV discount +15.0/15.0
- DSCR +7.7/10.0
- 1% rule +6.9/10.0
- Livability +3.2/5.0
- Rent growth +2.5/5.0
- Schools +2.5/10.0
- Condition / age +2.5/5.0
- Appreciation +0.0/10.0
$150,000
🖨 Deal sheet (PDF) 📄 Offer letter ✓ Due diligence
Listing remarks
Investor special in Shasta Lake City! Located at 1911 Oregon Street, this 3-bedroom, 2-bathroom home offers a great opportunity for investors, flippers, or buyers looking to build equity through renovation. The property is a true fixer-upper and will require an extensive remodel, including interior cleanout and significant yard and debris cleanup. The roof appears to be in good condition, providing a solid starting point for your improvements. This is a project suited for someone not afraid of hard work and ready to bring their vision to life. With strong upside potential, this property is being sold as-is and is available for cash purchase only.
Key facts
- 7,840 sq ft lot
- 2 garage spots
- Built 1991
Neighborhood map
What this means for you Summary
Snapshot
- This is a 3-bed/2.0-bath single-family listed at $150k.
Deal economics
- At list price, monthly cash flow is $224 ($3k/yr) — positive.
- The deal already cash-flows at list — no discount required.
- Meets the 1% rule at list price ($2k rent vs $150k).
- Cap rate 8.6% vs local median 3.7% in Shasta Lake — top-decile yield for the area; either an underpriced asset or a hidden risk that comps aren't pricing in. Stress-test before assuming the spread holds.
Location & tenants
- Location reads 65/100 on livability (#399 in CA) — a middle-class / working-renter tenant base. Strengths: housing A+, health & safety A+, commute A; Watch: employment C-, crime F, amenities F.
- Gateway Unified (suburban): math 25% / reading 35% proficiency, ranked #355 of 517 in CA (top 69%) — families likely to look elsewhere, expect single-tenant / working-renter base with shorter leases.
- Zoned schools: Shasta Lake (math 27% / reading 36%, grade F, #816 of 1,571 statewide, top 52%, 616 students, 74% FRL); Central Valley High (math 42% / reading 67%, grade C-, #256 of 1,170 statewide, top 24%, 625 students, 60% FRL).
- Zoned-school proficiency averages 43% at this address vs 30% district-wide (+13 pts) — the actual schools serving this property are materially stronger than the Gateway Unified average implies; a family-tenant draw the district grade alone would hide.
- Market conditions: 96 active listings in the ZIP; 4 comparable units currently listed for rent nearby; rentals at typical pace (median 16d on market — plan ~3-4 weeks tenant-placement turnaround); 246 units permitted in Shasta County in 2024 (0 in 5+ unit buildings).
- This rent runs 32% of the median local income ($67k/yr) — at the standard rent-burdened threshold; future hikes will face affordability resistance.
Forward outlook
- Local home prices are declining (-3.0%/yr); year-one equity from $1k of loan paydown is wiped out by about $4k of value loss. Plan a longer hold.
- Shasta County population projected to shrink 9% by 2050 — rents likely to lag national; underwrite the cash flow, not the appreciation.
Negotiation context
- Only 0 days on market — expect competitive offers; lowballing is unlikely to land.
Risks & watch-outs
- Watch-outs: flood insurance adds $66/mo.
- Climate carrying-cost: major flood risk; severe wildfire risk; extreme-heat days projected 7→17/yr by 2055 (HVAC capex compounding) — expect insurance premiums to compound above CPI over the hold.
Questions for the listing agent
- What's the actual annual flood-insurance premium (NFIP or private), and is the property in a SFHA with mandatory coverage?
- Is there a deadline driving the sale (1031 exchange, divorce, estate, relocation)? That informs how much negotiation room exists.
- Schools are D-rated, which usually means shorter tenancies and higher turnover. Who's the typical renter profile here, and what's been the actual vacancy rate?
- Crime grade is F in this area — have there been break-ins, vandalism, or insurance claims at this property in the last 3 years? What carrier currently insures it and at what premium?
- What's the average days-on-market for RENTAL listings here right now (not sales)? A rising rental-DOM trend means longer vacancies and softer asking-rent achievability than the comps imply.
- What's the recent tenant-quality profile in this submarket — average credit score on applications, eviction rate, late-payment / NSF rate, and stable-employment percentage? A property-management company in the area should have these aggregated.
- How much new for-sale + rental construction is in the pipeline within 1–3 miles? Heavy new supply typically softens prices + rents 12–24 months out; constrained supply supports both.
Investment metrics
- 1% rule
- 1.19% ✓
- Cap rate
- 8.62%
- Cash-on-cash
- 8.31%
- DSCR
- 1.37
- GRM
- 7.0
CMA / ARV
- ARV (on-the-fly)
- $281,060
- Comps found
- 12
Show comp detail 12 sales within ~0.75 mi
| Address | Dist | Beds/Ba | Sqft | Sold | Price | $/sf | Match |
|---|---|---|---|---|---|---|---|
| 5038 Main St | 0.25mi | 3/2.0 | 1,148 (-4%) | 2mo | $309,000 | $269 | 80 |
| 5230 Front St | 0.24mi | 3/2.0 | 1,110 (-7%) | 12mo | $275,000 | $248 | 66 |
| 4829 Chico St | 0.39mi | 3/1.0 | 1,226 (+2%) | 9mo | $202,400 | $165 | 66 |
| 1717 Deer Creek Rd | 0.29mi | 2/2.0 (-1) | 1,314 (+10%) | 2mo | $285,000 | $217 | 64 |
| 4670 Williamette St | 0.37mi | 3/2.0 | 1,288 (+8%) | 9mo | $230,000 | $179 | 63 |
| 1329 Median Ave | 0.54mi | 4/2.0 (+1) | 1,234 (+3%) | 6mo | $305,000 | $247 | 59 |
| 5126 Moon Shadow Ct | 0.41mi | 3/2.0 | 1,301 (+9%) | 12mo | $305,000 | $234 | 56 |
| 4524 Main St | 0.53mi | 3/2.0 | 1,296 (+8%) | 7mo | $304,000 | $235 | 55 |
| 4344 Meade St | 0.62mi | 3/1.0 | 1,232 (+3%) | 8mo | $290,000 | $235 | 55 |
| 1140 Eugene Ave | 0.49mi | 3/1.0 | 1,058 (-12%) | 1mo | $299,900 | $283 | 53 |
| 1316 Grand River Ave | 0.51mi | 3/1.5 | 1,092 (-9%) | 10mo | $240,000 | $220 | 51 |
| 4229 Fort Peck St | 0.73mi | 3/1.0 | 1,053 (-12%) | 10mo | $161,000 | $153 | 33 |
Match score weights: distance 35% · size 25% · config 20% · recency 20%. Top-matched comps best support the ARV.
Projected returns pro-forma
-3.0% appreciation · 3.0% rent growth · sell at horizon
- IRR
- -6.3%
- Equity multiple
- 0.76×
- Total profit
- $-9,896
- Equity at exit
- $22,365
- IRR
- 3.4%
- Equity multiple
- 1.24×
- Total profit
- $10,261
- Equity at exit
- $12,969
Cash invested: $42,000 (down + closing). Projections, not guarantees.
Landlord ↔ Tenant lean methodology
- Overall (STATE)
- 18 Strongly Tenant-Friendly
- State California
- 18 Strongly Tenant-Friendly · D+13
- County
- — inherits STATE
- City
- — inherits STATE
ZIP-level market 96019
- Active inventory
- 96
- Price-to-rent
- 7.0×
Monthly cashflow live
- Estimated rent
- $1,780 medium interval (Pro) →
- Mortgage (P&I)
- −$787
- Tax from tax record
- −$266 /mo · $3,196/yr
- Insurance
- −$62
- Flood insurance flood zone
- −$66 /mo · $798/yr
- HOA
- −$0
- Vacancy / Maint / Mgmt
- −$374
- Net cashflow
- $224
Break-even live
Sensitivity live
| Price | -10% $309 | -5% $267 | +0% $224 | +5% $182 | +10% $140 |
|---|---|---|---|---|---|
| Rent | -10% $84 | -5% $154 | +0% $224 | +5% $295 | +10% $365 |
| Rate | -1.0pp $300 | -0.5pp $263 | base $224 | +0.5pp $186 | +1.0pp $146 |
UW: 25.0% down · 7.5% · 30yr · 1.5% tax · 5.0% vac · 8.0% maint · 8.0% mgmt
Financing live
Cash to close
- Down payment
- $37,500
- Closing costs
- $4,500
- Reserves months
- —
- Total cash needed
- —
Loan-product check · same deal, 3 products live
Conventional
25% down · 7.5% · 30yr
- Down + closing
- —
- Monthly P&I
- —
- Monthly cashflow
- —
- DSCR
- —
- Eligible?
- —
Personal DTI + credit; lowest rate.
DSCR
20% down · 8.5% · 30yr
- Down + closing
- —
- Monthly P&I
- —
- Monthly cashflow
- —
- DSCR
- —
- Eligible?
- —
No personal income docs; deal must DSCR.
Hard money
10% down · 12.0% · 12mo
- Down + closing
- —
- Monthly P&I
- —
- Monthly cashflow
- —
- DSCR
- —
- Eligible?
- —
Short-term bridge; refi at stabilization.
Rent comps 4 comps
| Address | Beds | Baths | Sqft | Rent | $/sqft | DOM | Units | Dist |
|---|---|---|---|---|---|---|---|---|
| 1833 Oregon St Shasta Lake, CA | 3.0 | 2.0 | 1292 | $1,850 | $1.43 | 15d | 1 | 0.05mi |
| 1840 Grand Coulee Blvd Shasta Lake, CA | 3.0 | 1.0 | 1344 | $1,850 | $1.38 | 46d | 1 | 0.08mi |
| 1707 Grand Coulee Blvd Unit B Shasta Lake, CA | 2.0 | 1.0 | 800 | $1,459 | $1.82 | 15d | 1 | 0.15mi |
| 4325 Fort Peck St Shasta Lake, CA | 2.0 | 1.0 | 864 | $1,600 | $1.85 | 15d | 1 | 0.64mi |
Listing history 3 events
-
2026-04-26historical
-
2026-04-24$150,000
-
2006-01-19soldstatus $205,000
ⓘ Source: listings_history table (triggers on properties + properties_extension) + one-shot
backfill from property_details.listing_events for pre-trigger history.
Tax reassessment forecast CA · Resets to sale price
- Current annual tax
- $3,196 · $266/mo
- Projected year-2 tax
- $3,196 · $266/mo
- Expected delta
- $0/yr ($0/mo · 0.0%)
ⓘ Screening estimate from a state-policy table — verify with the county assessor before closing.
Climate risk First Street
- Flood 7/10 Severe FEMA zone X (unshaded) · 60% chance over 30 yrs
- Wildfire 8/10 Severe
- Heat 8/10 Severe 7 d/yr ≥105°F today · 17 d/yr by 30 yrs out
- Wind 1/10 Low
- Air quality 10/10 Extreme 44 unhealthy d/yr today · 46 by 30 yrs out
Nearby sold comps map
Loading sold comps map…
Walkable amenities ~0.75 mi
Loading nearby amenities…
Taxation est. · year 1
- Rental income
- $21,362
- − Mortgage interest
- −$8,402
- − Property taxes
- −$3,196
- − Insurance
- −$1,547
- − Repairs & maintenance
- −$1,709
- − Management
- −$1,709
- − Depreciation
- −$4,364
- Taxable income
- $435
- Est. tax owed @ 24.0%
- −$104
- After-tax cash flow
- $2,589/yr
For passive investors: Depreciation is non-cash, so a rental often shows a tax loss while cash-flowing — sheltering income. Rental losses are passive: they offset passive income freely, and up to $25,000/yr can offset ordinary (W-2) income if you actively participate and your MAGI is under $100k (phasing out to $0 by $150k); unused losses carry forward. On sale, claimed depreciation is recaptured at up to 25%, and gains may owe capital-gains tax (a 1031 exchange can defer both). Figures are a year-1 estimate at your 24.0% rate — not tax advice; consult a CPA.
Schools (NCES district)
- District
- Gateway Unified
- NCES district ID
- 0614950
- Math proficiency
- 25% ▼ -5.00%
- Reading proficiency
- 35% ▲ 2.00%
- Median HH income
- $41,888
- Composite
- 25.39/100
- National rank
- #7465
- State rank
- #355 of 517 in CA
Livability — Shasta Lake
- Score
- 65/100
- State rank
- #399
- US rank
- #13546
Category grades
Schools grade is shown separately in the Schools card above.
Census & demographics
- Census place
- Shasta Lake, CA
- County
- Shasta County · 147,641 people
- City population
- 10,350
- Metro
- Redding, CA
- Population (ZIP)
- 10,350
- Household income
- $67,446
- Rent vs Own
- Severe rent burden
- 260.0
Population outlook (Shasta County) Hauer SSP2
- Today (2025)
- 179,231 people
- By 2030
- 176,953 · -1.3%
- By 2040
- 169,982 · -5.2%
- By 2050
- 162,547 · -9.3%
- By 2075
- 145,649 · -18.7%
- By 2100
- 123,025 · -31.4%
Race, ethnicity, and origin ACS 2023
- Neighborhood character
- Predominantly White (77%)
- Race & ethnicity
- White 77% Two or more races 12% Hispanic / Latino 9% Asian 4% Native American 2%
- Hispanic origin (detail)
- Mexican 8%
- Common ancestry
- Russian 4% Romanian 4% Italian 4%
- Foreign-born
- 2% · Canada
- Languages at home
- 94% English-only · Spanish 4% Other Asian/Pacific 1%
Political lean MEDSL · Shasta
- 2024 margin
- Solid R (+36.5) · D 30.5% · R 67.0% · Other 2.5%
- 2008→2024 swing
- -10.7pp toward R · 2008: -25.8pp · 2024: -36.5pp
- All cycles
- 2024: R+36.5 2020: R+33.1 2016: R+37.4 2012: R+30.3 2008: R+25.8
Not yet ingested
- Civics
- —
Market trends
- HPI YoY
- ▼ -194.66%
- Current HPI
- 170.6085
- Rent YoY
- —
- Metro
- Redding, CA
- State GDP YoY
- ▲ 3.21%
- F500 in state
- 116
Industry mix (Fortune 500 HQ in CA)
| Industry | F500 HQs | Revenue |
|---|---|---|
| Technology | 27 | $1,492B |
|
||
| Financial Services | 3 | $174B |
|
||
| Retail | 3 | $44B |
|
||
| Insurance | 3 | $26B |
|
||
| Media / Entertainment | 2 | $115B |
|
||
| Pharmaceuticals / Biotech | 2 | $62B |
|
||
Price history
-26.8% since first listed3 events — show timeline
- 2026-04-26 Delisted — SAOR
- 2026-04-24 Listed $150,000 SAOR
- 2006-01-19 Sold (Public Records) $205,000 Public Records
Property tax history
+7.1%/yrLatest (2025): $3,196 · +5.3% YoY. Source: county tax records.
Cash-flow waterfall
monthlySold comps — $/sqft
last 12 mo · ≤1 miLoading sold comps…