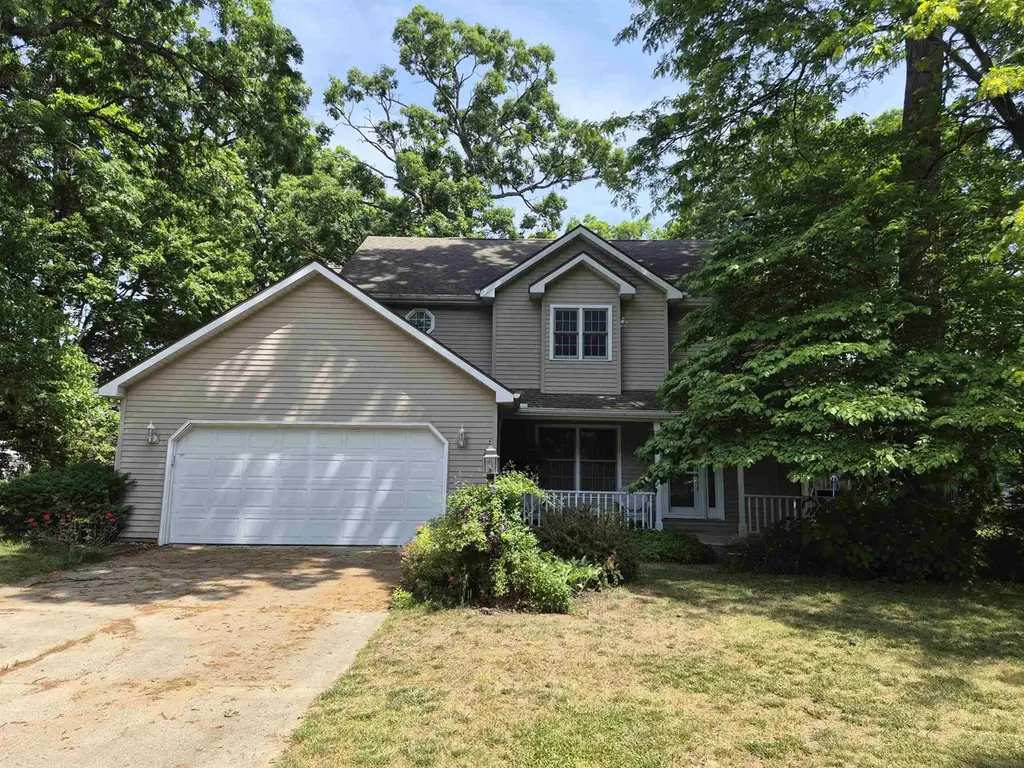
14491 Panda Ct
Mishawaka, IN 46545
$339,900D+
4 bd · 2.5 ba ·
2,232 sqft ·
Built 1990
· SingleFamily
· Active
· 1 DOM
Cashflow @ list (25.0% down · 7.5%)
Estimated rent
$2,537/mo
Mortgage (P&I)
−$1,782
Tax + insurance
−$324
HOA
−$0
Vac / Maint / Mgmt
−$533
Net cashflow
$-102/mo
Annual
$-1,228/yr
Cap rate
5.93%
Cash-on-cash
-1.29%
DSCR
0.94
1% rule
0.75%
Cash to close
$95,172
Investor read
- This is a 4-bed/2.5-bath single-family listed at $340k.
- At list price, monthly cash flow is $-102 ($-1k/yr) — negative.
- To cash-flow at today's rent, offer at most $322k (5.3% below list).
- To meet the 1% rule (rent ≥ 1% of price), the offer needs to be $254k (25.3% below list).
- Only 1 days on market — expect competitive offers; lowballing is unlikely to land.
- Recommended offer: $254k (25.3% below list) — sets the bar for 1% rule.
- Local home prices are declining (-3.0%/yr); year-one equity from $2k of loan paydown is wiped out by about $10k of value loss. Plan a longer hold.
- Location reads 76/100 on livability (#53 in IN, #3,586 nationally) — a middle-class / working-renter tenant base. Strengths: cost of living A+, housing A+, health & safety B; Watch: amenities F, employment F.
- Penn-Harris-Madison School Corporation (suburban): math 54% / reading 64% proficiency, ranked #19 of 301 in IN (top 6%) — acceptable for families but not a draw, mixed tenant base, ~2y average lease.
- Zoned schools: Elsie Rogers Elementary School (math 52% / reading 47%, grade D, #279 of 994 statewide, top 30%, 386 students, 42% FRL); Schmucker Middle School (math 40% / reading 56%, grade C-, #60 of 330 statewide, top 18%, 1,004 students, 36% FRL); Penn High School (math 53% / reading 83%, grade B, #22 of 369 statewide, top 6%, 3,624 students, 27% FRL).
- Market conditions: Rents rising fast (+5.2%/yr); 74 active listings in the ZIP; 2 comparable units currently listed for rent nearby; 754 units permitted in St. Joseph County in 2024 (460 in 5+ unit buildings).
- At $2,537/mo this rent would consume 54% of the median local household income ($57k/yr) (locally 1243% of renters already pay >50% of income on rent) — very limited rent-growth headroom before tenants either downsize or default.
Questions for listing agent
- What do current leases actually rent for vs. the listed asking? Can we see a recent rent roll and the last 12 months of T-12 income?
- Is there a deadline driving the sale (1031 exchange, divorce, estate, relocation)? That informs how much negotiation room exists.
- The area grade is low — what's the realistic commute time and amenity access for the typical tenant pool here? Any planned neighborhood developments (good or bad) we should know about?
- What's the average days-on-market for RENTAL listings here right now (not sales)? A rising rental-DOM trend means longer vacancies and softer asking-rent achievability than the comps imply.
- What's the recent tenant-quality profile in this submarket — average credit score on applications, eviction rate, late-payment / NSF rate, and stable-employment percentage? A property-management company in the area should have these aggregated.
- How much new for-sale + rental construction is in the pipeline within 1–3 miles? Heavy new supply typically softens prices + rents 12–24 months out; constrained supply supports both.
CashFlowRE · CFR-EG9QJR0BYD0JCW
· Data 3 days ago
cashflowre.app · 2026-05-29