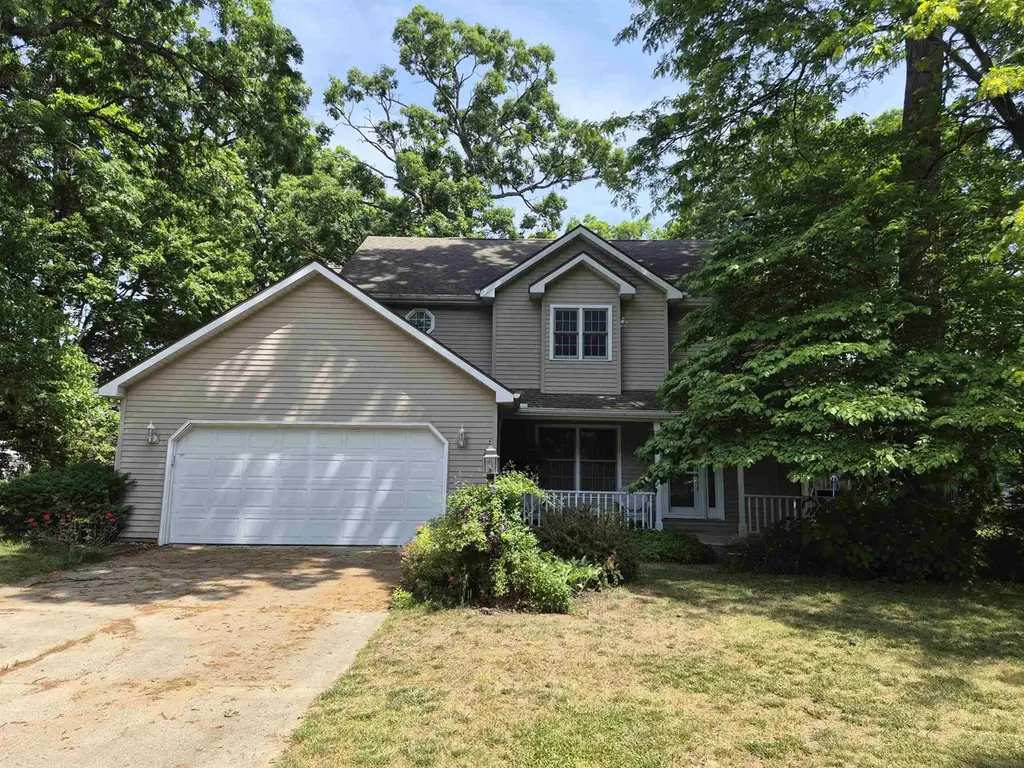
14491 Panda Ct · Mishawaka, IN
Flood risk 1/10 · Minimal
- FEMA flood zone
- X (unshaded)
- Chance of flooding over 30 yrs
- 0.0%
- Est. flood insurance / yr
- $473 – $860
Fire risk 1/10 · Minimal
- Est. fire insurance / yr
- $717 – $1,331
Heat risk 2/10 · Minimal
- Hot days now (above 99°F)
- 7 days/yr
- Hot days in 30 yrs
- 16 days/yr
Wind risk 2/10 · Minimal
- Chance of severe wind over 30 yrs
- —
Air-quality risk 3/10 · Minor
- Unhealthy air days now
- 2 days/yr
- Unhealthy air days in 30 yrs
- 3 days/yr
Risk factors via First Street. Map © Google.
Why this score? — see what drove the D grade
The composite is a weighted blend of 9 inputs, each scored 0–100. Each bar is that input's sub-score; the figure is the points it added to the 100-point composite (weight × sub-score).
- ARV discount +12.2/15.0
- Cash flow +11.7/30.0
- Schools +5.1/10.0
- Rent growth +3.8/5.0
- Livability +3.8/5.0
- DSCR +3.4/10.0
- 1% rule +2.5/10.0
- Condition / age +2.5/5.0
- Appreciation +0.0/10.0
$339,900
🖨 Deal sheet 📄 Offer letter ✓ Due diligence
Listing remarks
Open House June 19th 4:30-6:00. If you've been looking for a home with character, space, and the opportunity to make it your own, this could be the one. Tucked among mature trees in Felicity Gardens and conveniently located near shopping, dining, and everyday amenities along Grape Road, this 4-bedroom home offers a solid foundation for your next chapter. Inside, you'll find timeless details including natural stained woodwork, solid wood six-panel doors, and a warm wood-burning fireplace that creates a cozy gathering space. The main-floor laundry room adds everyday convenience, while the unfinished basement provides plenty of storage or future expansion possibilities. The spacious primary
Key facts
- 0.4 acre lot
- 2 garage spots
- Built 1990
Property features AI
Finance
- Other: Located in the Felicity Gardens subdivision
Exterior
- Parking: Attached concrete 2-car garage
- Utilities: Private well water; Septic tank sewer
- Home design: Single-family residence; Site-built home; Two stories
- Construction: Vinyl siding; Shingle roof; Concrete perimeter foundation; Built as site-built construction
- Exterior features: Screened porch; Porch; Corner lot
Interior
- Kitchen: Dishwasher; Refrigerator; Gas range; Kitchen island; Eat-in layout
- Bedrooms: Total rooms: 7
- Flooring: Laminate counters mentioned (flooring type not specified)
- Bathrooms: Two full bathrooms; One half bathroom; One main-level bathroom
- Heating & cooling: Natural gas forced-air heating; Central air conditioning
- Interior features: Walk-in closets; Entrance foyer; Crown molding; Eat-in kitchen; Kitchen island; Laminate counters; Wood-burning fireplace in the living room; Full unfinished basement with sump pump
- Laundry & utility: Washer; Dryer; Electric dryer hookup on the main level; Gas water heater
Neighborhood map
What this means for you Summary
Snapshot
- This is a 4-bed/2.5-bath single-family listed at $340k.
Deal economics
- At list price, monthly cash flow is $-102 ($-1k/yr) — negative.
- To cash-flow at today's rent, offer at most $322k (5.3% below list).
- To meet the 1% rule (rent ≥ 1% of price), the offer needs to be $254k (25.3% below list).
- Recommended offer: $254k (25.3% below list) — sets the bar for 1% rule.
Location & tenants
- Location reads 76/100 on livability (#53 in IN, #3,586 nationally) — a middle-class / working-renter tenant base. Strengths: cost of living A+, housing A+, health & safety B; Watch: amenities F, employment F.
- Penn-Harris-Madison School Corporation (suburban): math 54% / reading 64% proficiency, ranked #19 of 301 in IN (top 6%) — acceptable for families but not a draw, mixed tenant base, ~2y average lease.
- Zoned schools: Elsie Rogers Elementary School (math 52% / reading 47%, grade D, #279 of 994 statewide, top 30%, 386 students, 42% FRL); Schmucker Middle School (math 40% / reading 56%, grade C-, #60 of 330 statewide, top 18%, 1,004 students, 36% FRL); Penn High School (math 53% / reading 83%, grade B, #22 of 369 statewide, top 6%, 3,624 students, 27% FRL).
- Market conditions: Rents rising fast (+5.2%/yr); 74 active listings in the ZIP; 2 comparable units currently listed for rent nearby; 754 units permitted in St. Joseph County in 2024 (460 in 5+ unit buildings).
- At $2,537/mo this rent would consume 54% of the median local household income ($57k/yr) (locally 1243% of renters already pay >50% of income on rent) — very limited rent-growth headroom before tenants either downsize or default.
Forward outlook
- Local home prices are declining (-3.0%/yr); year-one equity from $2k of loan paydown is wiped out by about $10k of value loss. Plan a longer hold.
Negotiation context
- Only 1 days on market — expect competitive offers; lowballing is unlikely to land.
Questions for the listing agent
- What do current leases actually rent for vs. the listed asking? Can we see a recent rent roll and the last 12 months of T-12 income?
- Is there a deadline driving the sale (1031 exchange, divorce, estate, relocation)? That informs how much negotiation room exists.
- The area grade is low — what's the realistic commute time and amenity access for the typical tenant pool here? Any planned neighborhood developments (good or bad) we should know about?
- What's the average days-on-market for RENTAL listings here right now (not sales)? A rising rental-DOM trend means longer vacancies and softer asking-rent achievability than the comps imply.
- What's the recent tenant-quality profile in this submarket — average credit score on applications, eviction rate, late-payment / NSF rate, and stable-employment percentage? A property-management company in the area should have these aggregated.
- How much new for-sale + rental construction is in the pipeline within 1–3 miles? Heavy new supply typically softens prices + rents 12–24 months out; constrained supply supports both.
Investment metrics
- 1% rule
- 0.75% ✗
- Cap rate
- 5.93%
- Cash-on-cash
- -1.29%
- DSCR
- 0.94
- GRM
- 11.2
CMA / ARV
- ARV (on-the-fly)
- $379,440
- Comps found
- 5
Show comp detail 5 sales within ~0.75 mi
| Address | Dist | Beds/Ba | Sqft | Sold | Price | $/sf | Match |
|---|---|---|---|---|---|---|---|
| 14375 Pheasant Ct | 0.17mi | 4/2.5 | 2,180 (-2%) | 11mo | $370,000 | $170 | 79 |
| 14493 Lotus Ct | 0.06mi | 5/2.5 (+1) | 2,064 (-8%) | 6mo | $360,012 | $174 | 74 |
| 54344 Sagewood Dr | 0.30mi | 3/2.5 (-1) | 2,044 (-8%) | 2mo | $375,000 | $183 | 66 |
| 54496 Mystique Dr | 0.10mi | 3/2.5 (-1) | 2,342 (+5%) | 24mo | $327,000 | $140 | 62 |
| 14942 Douglas Rd | 0.74mi | 3/2.5 (-1) | 2,271 (+2%) | 7mo | $292,000 | $129 | 52 |
Match score weights: distance 35% · size 25% · config 20% · recency 20%. Top-matched comps best support the ARV.
Projected returns pro-forma
-3.0% appreciation · 5.2% rent growth · sell at horizon
- IRR
- -16.3%
- Equity multiple
- 0.41×
- Total profit
- $-55,965
- Equity at exit
- $50,680
- IRR
- -4.9%
- Equity multiple
- 0.65×
- Total profit
- $-32,935
- Equity at exit
- $29,388
Cash invested: $95,172 (down + closing). Projections, not guarantees.
Landlord ↔ Tenant lean methodology
- Overall (STATE)
- 90 Strongly Landlord-Friendly
- State Indiana
- 90 Strongly Landlord-Friendly · R+11
- County
- — inherits STATE
- City
- — inherits STATE
ZIP-level market 46545
- Rents YoY
- 5.2%
- Active inventory
- 74
- Price-to-rent
- 11.2×
Monthly cashflow live
- Estimated rent
- $2,537 medium interval (Pro) →
- Mortgage (P&I)
- −$1,782
- Tax from tax record
- −$183 /mo · $2,193/yr
- Insurance
- −$142
- HOA
- −$0
- Vacancy / Maint / Mgmt
- −$533
- Net cashflow
- $-102
Break-even live
UW: 25.0% down · 7.5% · 30yr · 1.5% tax · 5.0% vac · 8.0% maint · 8.0% mgmt
Financing live
Cash to close
- Down payment
- $84,975
- Closing costs
- $10,197
- Reserves months
- —
- Total cash needed
- —
Loan-product check · same deal, 3 products live
Conventional
25% down · 7.5% · 30yr
- Down + closing
- —
- Monthly P&I
- —
- Monthly cashflow
- —
- DSCR
- —
- Eligible?
- —
Personal DTI + credit; lowest rate.
DSCR
20% down · 8.5% · 30yr
- Down + closing
- —
- Monthly P&I
- —
- Monthly cashflow
- —
- DSCR
- —
- Eligible?
- —
No personal income docs; deal must DSCR.
Hard money
10% down · 12.0% · 12mo
- Down + closing
- —
- Monthly P&I
- —
- Monthly cashflow
- —
- DSCR
- —
- Eligible?
- —
Short-term bridge; refi at stabilization.
Rent comps 2 comps
| Address | Beds | Baths | Sqft | Rent | $/sqft | DOM | Units | Dist |
|---|---|---|---|---|---|---|---|---|
| 5504 Town Center Dr Granger, IN | 1.0–3.0 | 1.0–2.0 | 1035 | $2,676 | $2.59 | 13d | 48 | 1.27mi |
| 6205 N Fir Rd Granger, IN | 1.0–3.0 | 1.0–2.0 | 1285 | $2,671 | $2.08 | 13d | 22 | 1.32mi |
Listing history 9 events
-
2026-06-18statusdays on market $339,900 Active 1 DOM
-
2026-06-17days on market $339,900 Coming Soon 9 DOM
-
2026-06-16days on market $339,900 Coming Soon 8 DOM
-
2026-06-15days on market $339,900 Coming Soon 7 DOM
-
2026-06-14days on market $339,900 Coming Soon 5 DOM
-
2026-06-13days on market $339,900 Coming Soon 4 DOM
-
2026-06-10days on market $339,900 Coming Soon 2 DOM
-
2026-06-09remarks 699-char remark
-
2026-06-09$339,900 Coming Soon 1 DOM
ⓘ Source: listings_history table (triggers on properties + properties_extension) + one-shot
backfill from property_details.listing_events for pre-trigger history.
Tax reassessment forecast IN · Partial reset (capped growth)
- Current annual tax
- $2,193 · $183/mo
- Projected year-2 tax
- $2,541 · $212/mo
- Expected delta
- +$348/yr (+$29/mo · 15.9%)
ⓘ Screening estimate from a state-policy table — verify with the county assessor before closing.
Climate risk First Street
- Flood 1/10 Low FEMA zone X (unshaded) · 0% chance over 30 yrs
- Wildfire 1/10 Low
- Heat 2/10 Low 7 d/yr ≥99°F today · 16 d/yr by 30 yrs out
- Wind 2/10 Low
- Air quality 3/10 Moderate 2 unhealthy d/yr today · 3 by 30 yrs out
Nearby sold comps map
Loading sold comps map…
Walkable amenities ~0.75 mi
Loading nearby amenities…
Taxation est. · year 1
- Rental income
- $30,448
- − Mortgage interest
- −$19,040
- − Property taxes
- −$2,193
- − Insurance
- −$1,700
- − Repairs & maintenance
- −$2,436
- − Management
- −$2,436
- − Depreciation
- −$9,888
- Taxable loss
- −$7,243
- Est. tax savings @ 24.0%
- +$1,738
- After-tax cash flow
- $511/yr
For passive investors: Depreciation is non-cash, so a rental often shows a tax loss while cash-flowing — sheltering income. Rental losses are passive: they offset passive income freely, and up to $25,000/yr can offset ordinary (W-2) income if you actively participate and your MAGI is under $100k (phasing out to $0 by $150k); unused losses carry forward. On sale, claimed depreciation is recaptured at up to 25%, and gains may owe capital-gains tax (a 1031 exchange can defer both). Figures are a year-1 estimate at your 24.0% rate — not tax advice; consult a CPA.
Schools (NCES district)
- District
- Penn-Harris-Madison School Corporation
- NCES district ID
- 1808760
- Math proficiency
- 54% ▼ -11.00%
- Reading proficiency
- 64% ▼ -6.00%
- Median HH income
- $59,421
- Composite
- 51.11/100
- National rank
- #1764
- State rank
- #19 of 301 in IN
Livability — Mishawaka
- Score
- 76/100
- State rank
- #53
- US rank
- #3586
Category grades
Schools grade is shown separately in the Schools card above.
Census & demographics
- County
- Saint Joseph County · 189,048 people
- City population
- 57,683
- Metro
- South Bend-Mishawaka, IN-MI
- Population (ZIP)
- 26,606
- Household income
- $56,865
- Rent vs Own
- Severe rent burden
- 1243.0
Population outlook (St. Joseph County) Hauer SSP2
- Today (2025)
- 273,186 people
- By 2030
- 273,594 · +0.1%
- By 2040
- 271,641 · -0.6%
- By 2050
- 269,187 · -1.5%
- By 2075
- 263,136 · -3.7%
- By 2100
- 245,659 · -10.1%
Race, ethnicity, and origin ACS 2023
- Neighborhood character
- Predominantly White (78%)
- Race & ethnicity
- White 78% Two or more races 8% Black 7% Hispanic / Latino 6% Asian 3%
- Hispanic origin (detail)
- Mexican 2%
- Common ancestry
- Romanian 6% Lithuanian 2% English 2%
- Foreign-born
- 8% · Canada, China, South Korea
- Languages at home
- 90% English-only · Spanish 4% Chinese 1% Other Indo-European 1%
Political lean MEDSL · St. Joseph
- 2024 margin
- Toss-up / Even · D 50.0% · R 48.5% · Other 1.5%
- 2008→2024 swing
- -15.6pp toward R · 2008: 17.1pp · 2024: 1.5pp
- All cycles
- 2024: D+1.5 2020: D+5.8 2016: D+0.2 2012: D+3.5 2008: D+17.1
Not yet ingested
- Civics
- —
Market trends
- HPI YoY
- ▼ -114.83%
- Current HPI
- 188.2811
- Rent YoY
- ▲ 5.20%
- Metro
- South Bend-Mishawaka, IN-MI
- State GDP YoY
- ▲ 2.90%
- F500 in state
- 18
Industry mix (Fortune 500 HQ in IN)
| Industry | F500 HQs | Revenue |
|---|---|---|
| Industrial Machinery | 2 | $37B |
|
||
| Healthcare | 1 | $177B |
|
||
| Pharmaceuticals | 1 | $45B |
|
||
| Metals / Steel | 1 | $18B |
|
||
| Agriculture | 1 | $17B |
|
||
| Packaging | 1 | $12B |
|
||
Price history
1 event — show timeline
- 2026-06-08 Coming Soon $339,900 IRMLS
Property tax history
+1.3%/yrLatest (2025): $2,193 · -14.4% YoY. Source: county tax records.
Cash-flow waterfall
monthlySold comps — $/sqft
last 12 mo · ≤1 miLoading sold comps…