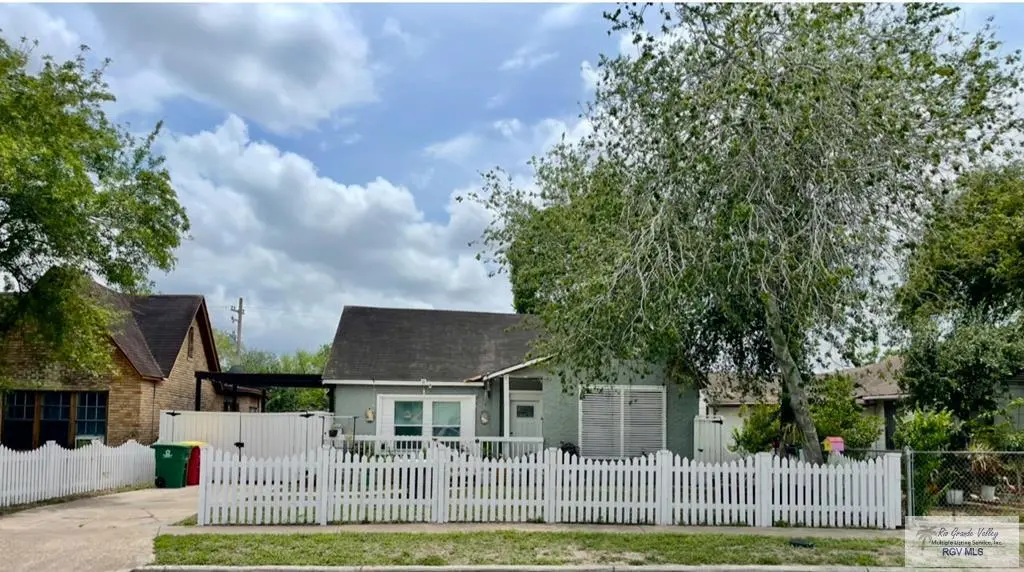
1645 W Elizabeth St
Brownsville, TX 78520
$199,000D
3 bd · 2.0 ba ·
1,324 sqft ·
Built 1973
· SingleFamily
· Active
· 19 DOM
Cashflow @ list (25.0% down · 7.5%)
Estimated rent
$1,626/mo
Mortgage (P&I)
−$1,044
Tax + insurance
−$265
HOA
−$0
Vac / Maint / Mgmt
−$342
Net cashflow
$-24/mo
Annual
$-290/yr
Cap rate
6.15%
Cash-on-cash
-0.52%
DSCR
0.98
1% rule
0.82%
Cash to close
$55,720
Investor read
- This is a 3-bed/2.0-bath single-family listed at $199k.
- At list price, monthly cash flow is $-24 ($-290/yr) — negative.
- To cash-flow at today's rent, offer at most $195k (2.1% below list).
- To meet the 1% rule (rent ≥ 1% of price), the offer needs to be $163k (18.3% below list).
- It's been on market 19 days — a 2% lower offer ($196k) is reasonable based on typical stale-listing flexibility.
- Recommended offer: $163k (18.3% below list) — sets the bar for 1% rule.
- Local home prices are declining (-3.0%/yr); year-one equity from $1k of loan paydown is wiped out by about $6k of value loss. Plan a longer hold.
- Location reads 79/100 on livability (#62 in TX, #2,311 nationally) — a middle-class / working-renter tenant base. Strengths: commute A+, cost of living A+, housing A+; Watch: amenities D, crime D-, employment F.
- Brownsville ISD (urban): math 20% / reading 34% proficiency, ranked #710 of 826 in TX (top 86%) — low school quality limits family demand, transient renter base, plan for 1-2y turnover; 83% free/reduced lunch — lower-income household profile, screen leases tightly.
- Zoned schools: Russell El (math 12% / reading 25%, grade F, #3,759 of 4,322 statewide, top 88%, 486 students, 98% FRL); Stell Middle (math 12% / reading 26%, grade F, #1,466 of 1,662 statewide, top 89%, 781 students, 96% FRL); Pace Early College H S (math 32% / reading 33%, grade F, #1,029 of 1,632 statewide, top 64%, 1,788 students, 92% FRL).
- Market conditions: Rents rising fast (+11.4%/yr); 346 active listings in the ZIP; 20 comparable units currently listed for rent nearby; rentals lingering (median 44d on market — plan ~5-8 weeks vacancy on turnover, expect pricing pressure); 60% of comp listings sitting > 30 days — soft ceiling on asking rent; 2,326 units permitted in Cameron County in 2024 (503 in 5+ unit buildings).
- Cameron County population projected at +3% by 2050 — modest demand growth; plan on rents tracking national, not racing it.
- 5 sale attempts since 5y ago with the ask held roughly flat each time — persistent listings suggest the price (not the market) is what's stuck; bring a comps-based counter.
- Climate carrying-cost: severe wind risk, 99% chance of damaging wind over 30y; extreme-heat days projected 7→25/yr by 2055 (HVAC capex compounding) — expect insurance premiums to compound above CPI over the hold.
- Cap rate 6.1% vs local median 5.0% in Brownsville — meaningfully above typical; check what's discounted (condition, days-on-market, listing class) to confirm the premium yield is real.
- This rent runs 39% of the median local income ($50k/yr) — at the standard rent-burdened threshold; future hikes will face affordability resistance.
Questions for listing agent
- What do current leases actually rent for vs. the listed asking? Can we see a recent rent roll and the last 12 months of T-12 income?
- Built in 1973 — when were the roof, HVAC, electrical panel, plumbing, and water heater last replaced?
- Is there a deadline driving the sale (1031 exchange, divorce, estate, relocation)? That informs how much negotiation room exists.
- Crime grade is D in this area — have there been break-ins, vandalism, or insurance claims at this property in the last 3 years? What carrier currently insures it and at what premium?
- The area grade is low — what's the realistic commute time and amenity access for the typical tenant pool here? Any planned neighborhood developments (good or bad) we should know about?
- What's the average days-on-market for RENTAL listings here right now (not sales)? A rising rental-DOM trend means longer vacancies and softer asking-rent achievability than the comps imply.
- What's the recent tenant-quality profile in this submarket — average credit score on applications, eviction rate, late-payment / NSF rate, and stable-employment percentage? A property-management company in the area should have these aggregated.
- How much new for-sale + rental construction is in the pipeline within 1–3 miles? Heavy new supply typically softens prices + rents 12–24 months out; constrained supply supports both.
CashFlowRE · CFR-EG9TZE1WNZKDTY
· Data 2 days ago
cashflowre.app · 2026-05-29