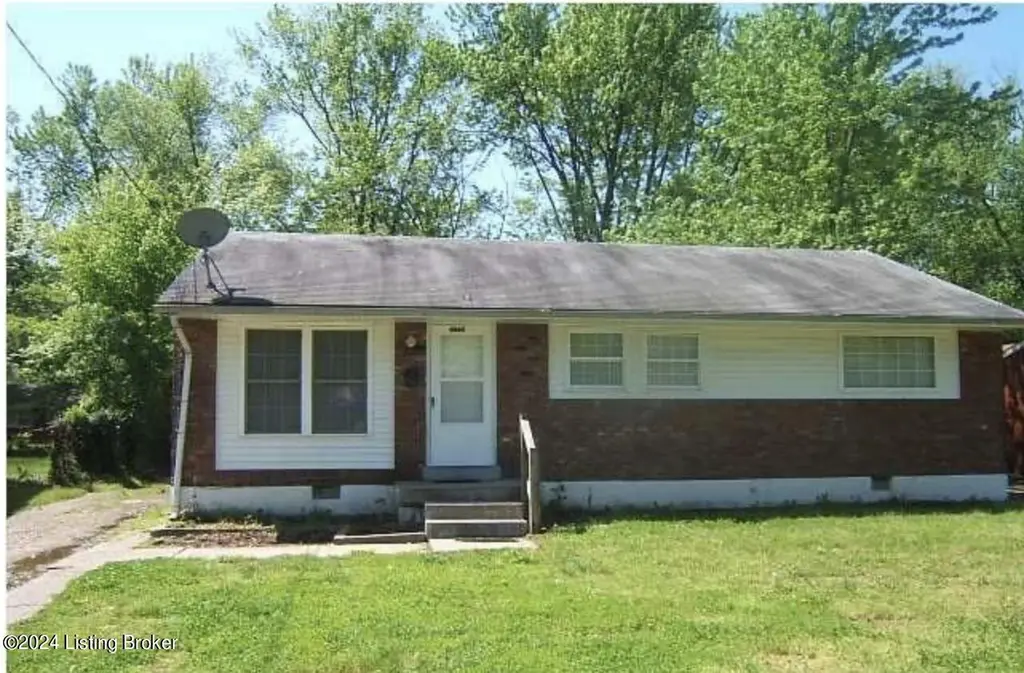
4908 Red Oak Ln
Louisville/Jefferson County metro government (balance), KY 40218
$142,000C+
4 bd · 1.0 ba ·
1,174 sqft ·
Built 1969
· SingleFamily
· Pending
· 13 DOM
Cashflow @ list (25.0% down · 7.5%)
Estimated rent
$1,617/mo
Mortgage (P&I)
−$745
Tax + insurance
−$189
HOA
−$0
Vac / Maint / Mgmt
−$340
Net cashflow
$344/mo
Annual
$4,128/yr
Cap rate
9.20%
Cash-on-cash
10.38%
DSCR
1.46
1% rule
1.14%
Cash to close
$39,760
Investor read
- This is a 4-bed/1.0-bath single-family listed at $142k.
- At list price, monthly cash flow is $344 ($4k/yr) — positive.
- The deal already cash-flows at list — no discount required.
- Meets the 1% rule at list price ($2k rent vs $142k).
- Only 13 days on market — expect competitive offers; lowballing is unlikely to land.
- Local home prices are declining (-3.0%/yr); year-one equity from $982 of loan paydown is wiped out by about $4k of value loss. Plan a longer hold.
- Location reads: area grade C — affects rentability + tenant quality, not the cash-flow math above.
- Jefferson County (urban): math 19% / reading 35% proficiency, ranked #121 of 165 in KY (top 73%) — low school quality limits family demand, transient renter base, plan for 1-2y turnover.
- Market conditions: Rents falling (-3.5%/yr); 100 active listings in the ZIP; 10 comparable units currently listed for rent nearby; rentals at typical pace (median 17d on market — plan ~3-4 weeks tenant-placement turnaround); 2,836 units permitted in Jefferson County in 2024 (1,558 in 5+ unit buildings).
- Jefferson County population projected at +13% by 2050 — modest demand growth; plan on rents tracking national, not racing it.
- 3 sale attempts since 15y ago; this cycle's ask is 42% above the opening price — seller raised mid-cycle; expect resistance to lowballs.
- Current owner paid $85k; list at $142k implies a 67% gain — meaningful room to come down on a strong offer.
- Climate carrying-cost: moderate flood risk; extreme-heat days projected 7→20/yr by 2055 (HVAC capex compounding) — expect insurance premiums to compound above CPI over the hold.
- Cap rate 9.2% vs local median 4.0% in Louisville/Jefferson County metro government (balance) — top-decile yield for the area; either an underpriced asset or a hidden risk that comps aren't pricing in. Stress-test before assuming the spread holds.
- This rent runs 33% of the median local income ($59k/yr) — at the standard rent-burdened threshold; future hikes will face affordability resistance.
Questions for listing agent
- Built in 1969 — when were the roof, HVAC, electrical panel, plumbing, and water heater last replaced?
- Is there a deadline driving the sale (1031 exchange, divorce, estate, relocation)? That informs how much negotiation room exists.
- What's the average days-on-market for RENTAL listings here right now (not sales)? A rising rental-DOM trend means longer vacancies and softer asking-rent achievability than the comps imply.
- What's the recent tenant-quality profile in this submarket — average credit score on applications, eviction rate, late-payment / NSF rate, and stable-employment percentage? A property-management company in the area should have these aggregated.
- How much new for-sale + rental construction is in the pipeline within 1–3 miles? Heavy new supply typically softens prices + rents 12–24 months out; constrained supply supports both.
CashFlowRE · CFR-EGCKY3AF00ABF1
· Data 1 week ago
cashflowre.app · 2026-05-29