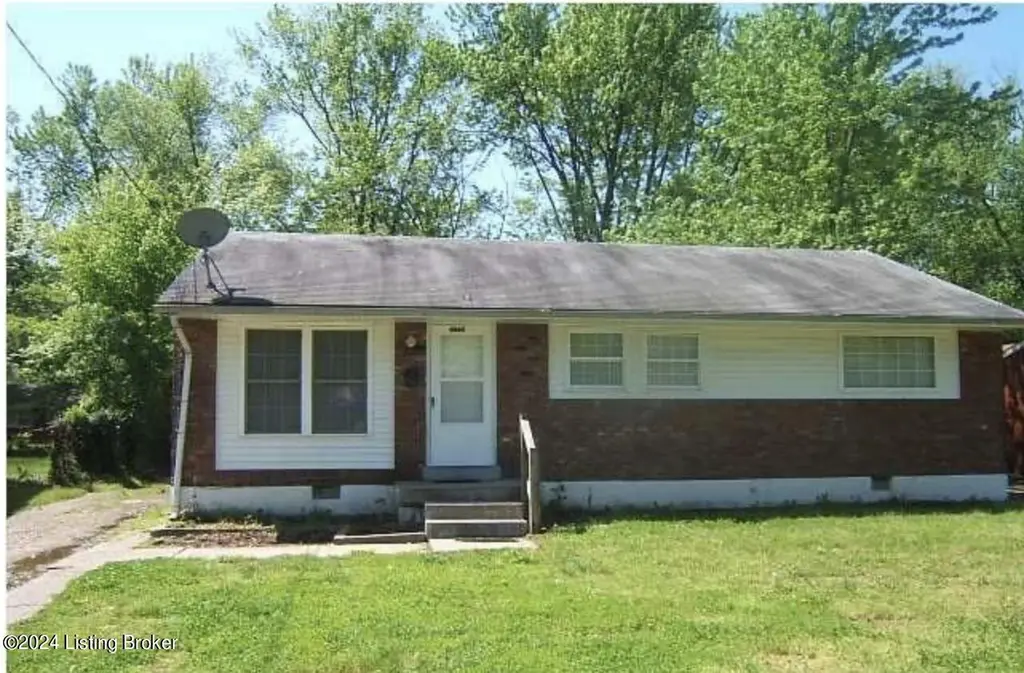
4908 Red Oak Ln · Louisville/Jefferson County metro government (balance), KY
Flood risk 5/10 · Moderate
- FEMA flood zone
- X (unshaded)
- Chance of flooding over 30 yrs
- 0.47%
- Est. flood insurance / yr
- $507 – $1,088
Fire risk 1/10 · Minimal
- Est. fire insurance / yr
- $839 – $1,559
Heat risk 5/10 · Moderate
- Hot days now (above 105°F)
- 7 days/yr
- Hot days in 30 yrs
- 20 days/yr
Wind risk 2/10 · Minimal
- Chance of severe wind over 30 yrs
- 2.0%
Air-quality risk 3/10 · Minor
- Unhealthy air days now
- 3 days/yr
- Unhealthy air days in 30 yrs
- 5 days/yr
Risk factors via First Street. Map © Google.
Why this score? — see what drove the C+ grade
The composite is a weighted blend of 9 inputs, each scored 0–100. Each bar is that input's sub-score; the figure is the points it added to the 100-point composite (weight × sub-score).
- Cash flow +25.8/30.0
- ARV discount +15.0/15.0
- DSCR +8.6/10.0
- 1% rule +6.4/10.0
- Livability +2.5/5.0
- Condition / age +2.5/5.0
- Schools +2.3/10.0
- Rent growth +1.6/5.0
- Appreciation +0.0/10.0
$142,000
🖨 Deal sheet 📄 Offer letter ✓ Due diligence
Listing remarks MLS
Property sold in as is condition, loan approval letter or verification of funds if cash, min $1,000.00 deposit (copy of check), seller disclosure, Termite Report, Lead Base Paint and agent checklist with all offers. AGENTS DO NOT SEND ANY OFFERS WITHOUT ALL OF THE ABOVE. This property is eligible under the Freddie Mac First Look Initiative through 5/24/2011. Offers only from Owner Occupants, Neighborhood Stabilization Program Grantees and non-profits engaged in community stabilization efforts will be considered the 1st 15 days of the listing. Investor offers will be considered on the 16th day of the listing which will be 5/25/2011 Seller is offering 2 Year HOW Warranty on Owner Occupied Properties only. If Buyer wants the 2 Year Warranty it must be written into the Orginal Offer to Purchase as follows: ''Seller to provide 2 Year HOW Warranty
Key facts
- 7,405 sq ft lot
- Garage
- Built 1969
Neighborhood map
What this means for you Summary
Snapshot
- This is a 4-bed/1.0-bath single-family listed at $142k.
Deal economics
- At list price, monthly cash flow is $344 ($4k/yr) — positive.
- The deal already cash-flows at list — no discount required.
- Meets the 1% rule at list price ($2k rent vs $142k).
- Cap rate 9.2% vs local median 4.0% in Louisville/Jefferson County metro government (balance) — top-decile yield for the area; either an underpriced asset or a hidden risk that comps aren't pricing in. Stress-test before assuming the spread holds.
Location & tenants
- Location reads: area grade C — affects rentability + tenant quality, not the cash-flow math above.
- Jefferson County (urban): math 19% / reading 35% proficiency, ranked #121 of 165 in KY (top 73%) — low school quality limits family demand, transient renter base, plan for 1-2y turnover.
- Market conditions: Rents falling (-3.5%/yr); 100 active listings in the ZIP; 10 comparable units currently listed for rent nearby; rentals at typical pace (median 17d on market — plan ~3-4 weeks tenant-placement turnaround); 2,836 units permitted in Jefferson County in 2024 (1,558 in 5+ unit buildings).
- This rent runs 33% of the median local income ($59k/yr) — at the standard rent-burdened threshold; future hikes will face affordability resistance.
Forward outlook
- Local home prices are declining (-3.0%/yr); year-one equity from $982 of loan paydown is wiped out by about $4k of value loss. Plan a longer hold.
- Jefferson County population projected at +13% by 2050 — modest demand growth; plan on rents tracking national, not racing it.
Negotiation context
- Only 13 days on market — expect competitive offers; lowballing is unlikely to land.
- 3 sale attempts since 15y ago; this cycle's ask is 42% above the opening price — seller raised mid-cycle; expect resistance to lowballs.
- Current owner paid $85k; list at $142k implies a 67% gain — meaningful room to come down on a strong offer.
Risks & watch-outs
- Climate carrying-cost: moderate flood risk; extreme-heat days projected 7→20/yr by 2055 (HVAC capex compounding) — expect insurance premiums to compound above CPI over the hold.
Questions for the listing agent
- Built in 1969 — when were the roof, HVAC, electrical panel, plumbing, and water heater last replaced?
- Is there a deadline driving the sale (1031 exchange, divorce, estate, relocation)? That informs how much negotiation room exists.
- What's the average days-on-market for RENTAL listings here right now (not sales)? A rising rental-DOM trend means longer vacancies and softer asking-rent achievability than the comps imply.
- What's the recent tenant-quality profile in this submarket — average credit score on applications, eviction rate, late-payment / NSF rate, and stable-employment percentage? A property-management company in the area should have these aggregated.
- How much new for-sale + rental construction is in the pipeline within 1–3 miles? Heavy new supply typically softens prices + rents 12–24 months out; constrained supply supports both.
Investment metrics
- 1% rule
- 1.14% ✓
- Cap rate
- 9.20%
- Cash-on-cash
- 10.38%
- DSCR
- 1.46
- GRM
- 7.3
CMA / ARV
- ARV (on-the-fly)
- $204,276
- Comps found
- 12
Show comp detail 12 sales within ~0.75 mi
| Address | Dist | Beds/Ba | Sqft | Sold | Price | $/sf | Match |
|---|---|---|---|---|---|---|---|
| 5407 Robinwood Rd | 0.16mi | 3/1.0 (-1) | 1,150 (-2%) | 5mo | $205,000 | $178 | 80 |
| 5402 Rustic Way | 0.06mi | 3/1.0 (-1) | 1,277 (+9%) | 2mo | $195,000 | $153 | 76 |
| 4884 Brenda Dr | 0.35mi | 3/1.0 (-1) | 1,147 (-2%) | 3mo | $185,000 | $161 | 72 |
| 5104 Red Oak Ln | 0.17mi | 3/1.0 (-1) | 1,235 (+5%) | 8mo | $180,000 | $146 | 72 |
| 5209 Cedrus Cir | 0.36mi | 3/1.0 (-1) | 1,190 (+1%) | 5mo | $155,000 | $130 | 71 |
| 1602 Rangeland Rd | 0.52mi | 4/1.0 | 1,210 (+3%) | 1mo | $210,000 | $174 | 70 |
| 4607 Plane Tree Dr | 0.38mi | 3/1.0 (-1) | 1,120 (-5%) | 5mo | $225,000 | $201 | 66 |
| 5305 Red Oak Ln | 0.41mi | 3/1.0 (-1) | 1,080 (-8%) | 2mo | $175,000 | $162 | 61 |
| 4911 Lagoona Dr | 0.58mi | 4/1.0 | 1,219 (+4%) | 8mo | $200,000 | $164 | 60 |
| 5208 Rural Way | 0.32mi | 3/1.0 (-1) | 1,050 (-11%) | 3mo | $215,000 | $205 | 60 |
| 5208 Garden Green Way | 0.56mi | 3/1.0 (-1) | 1,158 (-1%) | 8mo | $209,000 | $180 | 60 |
| 4805 E Indian Trl | 0.63mi | 3/2.0 (-1) | 1,334 (+14%) | 1mo | $240,000 | $180 | 38 |
Match score weights: distance 35% · size 25% · config 20% · recency 20%. Top-matched comps best support the ARV.
Projected returns pro-forma
-3.0% appreciation · 0.0% rent growth · sell at horizon
- IRR
- -4.1%
- Equity multiple
- 0.85×
- Total profit
- $-5,845
- Equity at exit
- $21,173
- IRR
- 1.9%
- Equity multiple
- 1.12×
- Total profit
- $4,786
- Equity at exit
- $12,278
Cash invested: $39,760 (down + closing). Projections, not guarantees.
Landlord ↔ Tenant lean methodology
- Overall (STATE)
- 83 Strongly Landlord-Friendly
- State Kentucky
- 83 Strongly Landlord-Friendly · R+16
- County
- — inherits STATE
- City
- — inherits STATE
ZIP-level market 40218
- Rents YoY
- -3.5%
- Active inventory
- 100
- Price-to-rent
- 7.3×
Monthly cashflow live
- Estimated rent
- $1,617 high interval (Pro) →
- Mortgage (P&I)
- −$745
- Tax from tax record
- −$130 /mo · $1,558/yr
- Insurance
- −$59
- HOA
- −$0
- Vacancy / Maint / Mgmt
- −$340
- Net cashflow
- $344
Break-even live
UW: 25.0% down · 7.5% · 30yr · 1.5% tax · 5.0% vac · 8.0% maint · 8.0% mgmt
Financing live
Cash to close
- Down payment
- $35,500
- Closing costs
- $4,260
- Reserves months
- —
- Total cash needed
- —
Loan-product check · same deal, 3 products live
Conventional
25% down · 7.5% · 30yr
- Down + closing
- —
- Monthly P&I
- —
- Monthly cashflow
- —
- DSCR
- —
- Eligible?
- —
Personal DTI + credit; lowest rate.
DSCR
20% down · 8.5% · 30yr
- Down + closing
- —
- Monthly P&I
- —
- Monthly cashflow
- —
- DSCR
- —
- Eligible?
- —
No personal income docs; deal must DSCR.
Hard money
10% down · 12.0% · 12mo
- Down + closing
- —
- Monthly P&I
- —
- Monthly cashflow
- —
- DSCR
- —
- Eligible?
- —
Short-term bridge; refi at stabilization.
Rent comps 10 comps
| Address | Beds | Baths | Sqft | Rent | $/sqft | DOM | Units | Dist |
|---|---|---|---|---|---|---|---|---|
| 4903 De Priest Ct Louisville, KY | 4.0 | 1.5 | 1283 | $1,850 | $1.44 | 10d | 1 | 0.34mi |
| 5117 Alba Way Louisville, KY | 3.0 | 1.0 | 900 | $1,450 | $1.61 | 23d | 1 | 0.35mi |
| 5809 Russett Pl Unit 5707-200 Louisville, KY | 3.0 | 1.0 | 1000 | $1,250 | $1.25 | 23d | 1 | 0.48mi |
| 5603 Regal Dr Louisville, KY | 3.0 | 1.0 | 947 | $1,500 | $1.58 | 16d | 1 | 0.49mi |
| 5319 Rangeland Rd Louisville, KY | 1.0–4.0 | 1.0–2.0 | 1225 | $1,810 | $1.48 | 3d | 10 | 0.62mi |
| 5111 Lammers Ln Louisville, KY | 3.0 | 1.0 | 1175 | $1,400 | $1.19 | 11d | 1 | 0.92mi |
| 4206 Saint Francis Ln Louisville, KY | 3.0 | 1.0 | 910 | $1,500 | $1.65 | 23d | 1 | 0.98mi |
| 4520 Norene Ln Louisville, KY | 3.0 | 2.0 | 1161 | $1,695 | $1.46 | 23d | 1 | 1.06mi |
| 5024 Delaware Dr Louisville, KY | 3.0 | 1.0 | 890 | $1,500 | $1.69 | 17d | 1 | 1.16mi |
| 3620 E Indian Trl Louisville, KY | 3.0 | 1.0 | 1134 | $1,495 | $1.32 | 3d | 1 | 1.25mi |
Listing history 7 events
-
2025-08-01soldstatus $85,000
-
2025-06-23historical
-
2025-06-23$100,000 Active
-
2024-02-01status Pending
-
2024-01-13$142,000 Active
-
2011-06-15soldstatus $31,500 853-char remark
Show marketing remark (853 chars)
Property sold in as is condition, loan approval letter or verification of funds if cash, min $1,000.00 deposit (copy of check), seller disclosure, Termite Report, Lead Base Paint and agent checklist with all offers. AGENTS DO NOT SEND ANY OFFERS WITHOUT ALL OF THE ABOVE. This property is eligible under the Freddie Mac First Look Initiative through 5/24/2011. Offers only from Owner Occupants, Neighborhood Stabilization Program Grantees and non-profits engaged in community stabilization efforts will be considered the 1st 15 days of the listing. Investor offers will be considered on the 16th day of the listing which will be 5/25/2011 Seller is offering 2 Year HOW Warranty on Owner Occupied Properties only. If Buyer wants the 2 Year Warranty it must be written into the Orginal Offer to Purchase as follows: ''Seller to provide 2 Year HOW Warranty
-
2011-05-10$31,900 853-char remark
Show marketing remark (853 chars)
Property sold in as is condition, loan approval letter or verification of funds if cash, min $1,000.00 deposit (copy of check), seller disclosure, Termite Report, Lead Base Paint and agent checklist with all offers. AGENTS DO NOT SEND ANY OFFERS WITHOUT ALL OF THE ABOVE. This property is eligible under the Freddie Mac First Look Initiative through 5/24/2011. Offers only from Owner Occupants, Neighborhood Stabilization Program Grantees and non-profits engaged in community stabilization efforts will be considered the 1st 15 days of the listing. Investor offers will be considered on the 16th day of the listing which will be 5/25/2011 Seller is offering 2 Year HOW Warranty on Owner Occupied Properties only. If Buyer wants the 2 Year Warranty it must be written into the Orginal Offer to Purchase as follows: ''Seller to provide 2 Year HOW Warranty
ⓘ Source: listings_history table (triggers on properties + properties_extension) + one-shot
backfill from property_details.listing_events for pre-trigger history.
Tax reassessment forecast KY · Resets to sale price
- Current annual tax
- $1,558 · $130/mo
- Projected year-2 tax
- $1,558 · $130/mo
- Expected delta
- $0/yr ($0/mo · 0.0%)
ⓘ Screening estimate from a state-policy table — verify with the county assessor before closing.
Climate risk First Street
- Flood 5/10 Major FEMA zone X (unshaded) · 47% chance over 30 yrs
- Wildfire 1/10 Low
- Heat 5/10 Major 7 d/yr ≥105°F today · 20 d/yr by 30 yrs out
- Wind 2/10 Low 2% chance of damaging wind over 30 yrs
- Air quality 3/10 Moderate 3 unhealthy d/yr today · 5 by 30 yrs out
Nearby sold comps map
Loading sold comps map…
Walkable amenities ~0.75 mi
Loading nearby amenities…
Taxation est. · year 1
- Rental income
- $19,408
- − Mortgage interest
- −$7,954
- − Property taxes
- −$1,558
- − Insurance
- −$710
- − Repairs & maintenance
- −$1,553
- − Management
- −$1,553
- − Depreciation
- −$4,131
- Taxable income
- $1,949
- Est. tax owed @ 24.0%
- −$468
- After-tax cash flow
- $3,660/yr
For passive investors: Depreciation is non-cash, so a rental often shows a tax loss while cash-flowing — sheltering income. Rental losses are passive: they offset passive income freely, and up to $25,000/yr can offset ordinary (W-2) income if you actively participate and your MAGI is under $100k (phasing out to $0 by $150k); unused losses carry forward. On sale, claimed depreciation is recaptured at up to 25%, and gains may owe capital-gains tax (a 1031 exchange can defer both). Figures are a year-1 estimate at your 24.0% rate — not tax advice; consult a CPA.
Schools (NCES district)
- District
- Jefferson County
- NCES district ID
- 2102990
- Math proficiency
- 19% ▼ -17.00%
- Reading proficiency
- 35% ▼ -11.00%
- Median HH income
- $47,885
- Composite
- 23.45/100
- National rank
- #7884
- State rank
- #121 of 165 in KY
Livability — Louisville/Jefferson County metro government (balance)
No livability data for this city. (Only ~50 U.S. cities are tracked.)
Census & demographics
- Census place
- Louisville/Jefferson County metro government (balance), KY
- County
- Jefferson County · 790,184 people
- City population
- 419,741
- Metro
- Louisville/Jefferson County, KY-IN
- Population (ZIP)
- 33,736
- Household income
- $58,811
- Rent vs Own
- Severe rent burden
- 1590.0
Population outlook (Jefferson County) Hauer SSP2
- Today (2025)
- 823,112 people
- By 2030
- 849,343 · +3.2%
- By 2040
- 895,696 · +8.8%
- By 2050
- 933,630 · +13.4%
- By 2075
- 1,028,262 · +24.9%
- By 2100
- 1,072,675 · +30.3%
Race, ethnicity, and origin ACS 2023
- Neighborhood character
- Diverse neighborhood (Simpson 0.69)
- Race & ethnicity
- White 42% Black 32% Hispanic / Latino 17% Two or more races 16% Asian 4%
- Hispanic origin (detail)
- Mexican 5% Puerto Rican 1% Cuban 7%
- Common ancestry
- Lithuanian 1% Portuguese 1% Swiss 1%
- Foreign-born
- 20% · Canada, India, Jamaica
- Languages at home
- 77% English-only · Spanish 12% Other Indo-European 3% Arabic 1%
Political lean MEDSL · Jefferson
- 2024 margin
- D (+16.6) · D 57.4% · R 40.9% · Other 1.7%
- 2008→2024 swing
- +4.5pp toward D · 2008: 12.0pp · 2024: 16.6pp
- All cycles
- 2024: D+16.6 2020: D+20.1 2016: D+13.3 2012: D+11.1 2008: D+12.0
Not yet ingested
- Civics
- —
Market trends
- HPI YoY
- ▼ -208.23%
- Current HPI
- 257.9528
- Rent YoY
- ▼ -3.47%
- Metro
- Louisville/Jefferson County, KY-IN
- State GDP YoY
- ▲ 1.81%
- F500 in state
- 4
Industry mix (Fortune 500 HQ in KY)
| Industry | F500 HQs | Revenue |
|---|---|---|
| Healthcare | 1 | $118B |
|
||
| Food / Beverage | 1 | $7B |
|
||
Price history
+166.5% since first listed7 events — show timeline
- 2025-08-01 Sold (Public Records) $85,000 Public Records
- 2025-06-23 Listed $100,000 Metro Search MLS
- 2025-06-23 Listing Removed — Metro Search MLS
- 2024-02-01 Pending — Metro Search MLS
- 2024-01-13 Listed $142,000 Metro Search MLS
- 2011-06-15 Sold (MLS) $31,500 Metro Search MLS
- 2011-05-10 Listed $31,900 Metro Search MLS
Property tax history
+7.8%/yrLatest (2025): $1,558 · +56.0% YoY. Source: county tax records.
Cash-flow waterfall
monthlySold comps — $/sqft
last 12 mo · ≤1 miLoading sold comps…