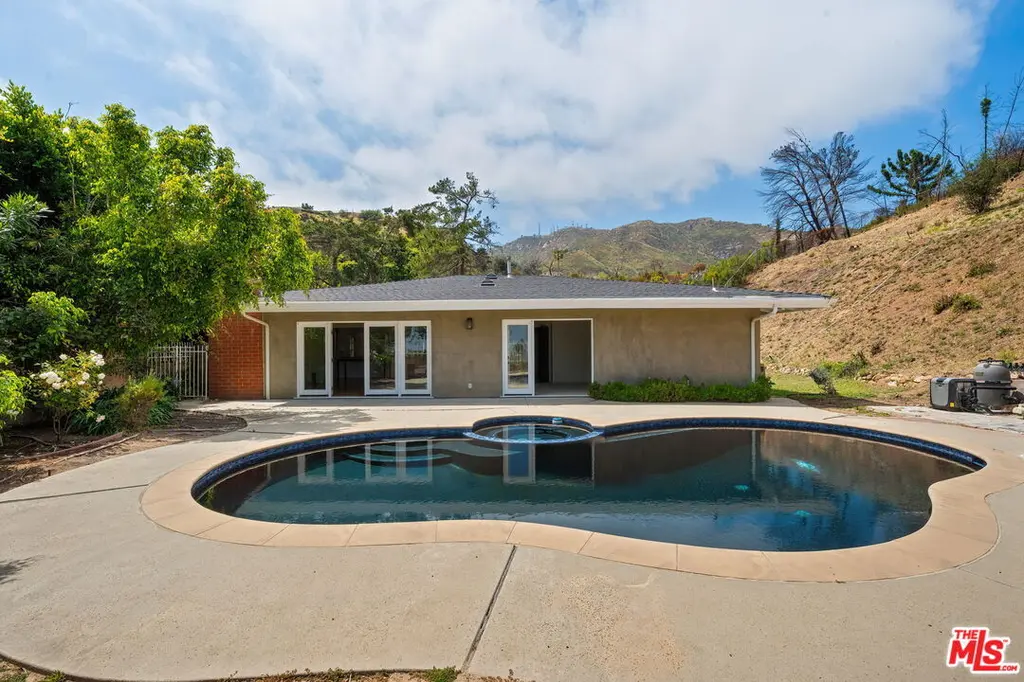
1812 Manzanita Park Ave
Malibu, CA 90265
$1,499,000D
3 bd · 2.0 ba ·
1,952 sqft ·
Built 1967
· SingleFamily
· Pending
· 12 DOM
Cashflow @ list (25.0% down · 7.5%)
Estimated rent
$10,885/mo
Mortgage (P&I)
−$7,861
Tax + insurance
−$1,468
HOA
−$0
Vac / Maint / Mgmt
−$2,286
Net cashflow
$-730/mo
Annual
$-8,761/yr
Cap rate
5.71%
Cash-on-cash
-2.09%
DSCR
0.91
1% rule
0.73%
Cash to close
$419,720
Investor read
- This is a 3-bed/2.0-bath single-family listed at $1.50M.
- At list price, monthly cash flow is $-730 ($-9k/yr) — negative.
- To cash-flow at today's rent, offer at most $1.37M (8.6% below list).
- To meet the 1% rule (rent ≥ 1% of price), the offer needs to be $1.09M (27.4% below list).
- Only 12 days on market — expect competitive offers; lowballing is unlikely to land.
- Recommended offer: $1.09M (27.4% below list) — sets the bar for 1% rule.
- In year one you build about $20k of equity ($10k loan paydown + $9k appreciation (0.6% local appreciation)).
- Location reads 53/100 on livability (#979 in CA) — a working-class tenant base; expect higher turnover. Strengths: employment A+; Watch: housing C-, crime F, amenities F.
- Santa Monica-Malibu Unified (urban): math 61% / reading 74% proficiency, ranked #123 of 1,400 in CA (top 9%) — acceptable for families but not a draw, mixed tenant base, ~2y average lease.
- Zoned schools: Webster Elementary (214 students, 10% FRL).
- Market conditions: Rents falling (-3.4%/yr); 640 active listings in the ZIP; high-income renter base; 19,697 units permitted in Los Angeles County in 2024 (9,426 in 5+ unit buildings).
- Los Angeles County population projected at +9% by 2050 — modest demand growth; plan on rents tracking national, not racing it.
- 7 sale attempts since 24y ago with the ask held roughly flat each time — persistent listings suggest the price (not the market) is what's stuck; bring a comps-based counter.
- Current owner paid $792k; list at $1.50M implies a 89% gain — meaningful room to come down on a strong offer.
- By year 5, paydown + projected appreciation supports a ~$96k cash-out refi (75% LTV) — recoverable capital for the next deal without selling this one.
- Climate carrying-cost: severe wildfire risk — expect insurance premiums to compound above CPI over the hold.
- Cap rate 5.7% vs local median 0.7% in Malibu — top-decile yield for the area; either an underpriced asset or a hidden risk that comps aren't pricing in. Stress-test before assuming the spread holds.
- At $10,885/mo this rent would consume 66% of the median local household income ($197k/yr) (locally 420% of renters already pay >50% of income on rent) — very limited rent-growth headroom before tenants either downsize or default.
Questions for listing agent
- What do current leases actually rent for vs. the listed asking? Can we see a recent rent roll and the last 12 months of T-12 income?
- Built in 1967 — when were the roof, HVAC, electrical panel, plumbing, and water heater last replaced?
- Is there a deadline driving the sale (1031 exchange, divorce, estate, relocation)? That informs how much negotiation room exists.
- Schools are B-rated — typically a magnet for longer-tenancy family renters. What's the average tenant stay here, and is there a school-zone premium baked into asking?
- Crime grade is F in this area — have there been break-ins, vandalism, or insurance claims at this property in the last 3 years? What carrier currently insures it and at what premium?
- The area grade is low — what's the realistic commute time and amenity access for the typical tenant pool here? Any planned neighborhood developments (good or bad) we should know about?
- What's the average days-on-market for RENTAL listings here right now (not sales)? A rising rental-DOM trend means longer vacancies and softer asking-rent achievability than the comps imply.
- What's the recent tenant-quality profile in this submarket — average credit score on applications, eviction rate, late-payment / NSF rate, and stable-employment percentage? A property-management company in the area should have these aggregated.
CashFlowRE · CFR-EGZYCH4H7QNBXR
· Data 2 weeks ago
cashflowre.app · 2026-05-29