1812 Manzanita Park Ave · Malibu, CA
Flood risk 1/10 · Minimal
- FEMA flood zone
- D
- Chance of flooding over 30 yrs
- 0.0%
- Est. flood insurance / yr
- $544 – $1,084
Fire risk 8/10 · Major
- Est. fire insurance / yr
- $659 – $1,223
Heat risk 4/10 · Minor
- Hot days now (above 83°F)
- 7 days/yr
- Hot days in 30 yrs
- 19 days/yr
Wind risk 1/10 · Minimal
- Chance of severe wind over 30 yrs
- —
Air-quality risk 5/10 · Moderate
- Unhealthy air days now
- 6 days/yr
- Unhealthy air days in 30 yrs
- 8 days/yr
Risk factors via First Street. Map © Google.
Why this score? — see what drove the D grade
The composite is a weighted blend of 9 inputs, each scored 0–100. Each bar is that input's sub-score; the figure is the points it added to the 100-point composite (weight × sub-score).
- Cash flow +10.6/30.0
- ARV discount +7.5/15.0
- Schools +6.2/10.0
- Appreciation +5.3/10.0
- DSCR +3.1/10.0
- Livability +2.7/5.0
- Condition / age +2.5/5.0
- 1% rule +2.3/10.0
- Rent growth +1.7/5.0
$1,499,000
🖨 Deal sheet (PDF) 📄 Offer letter ✓ Due diligence
Listing remarks MLS
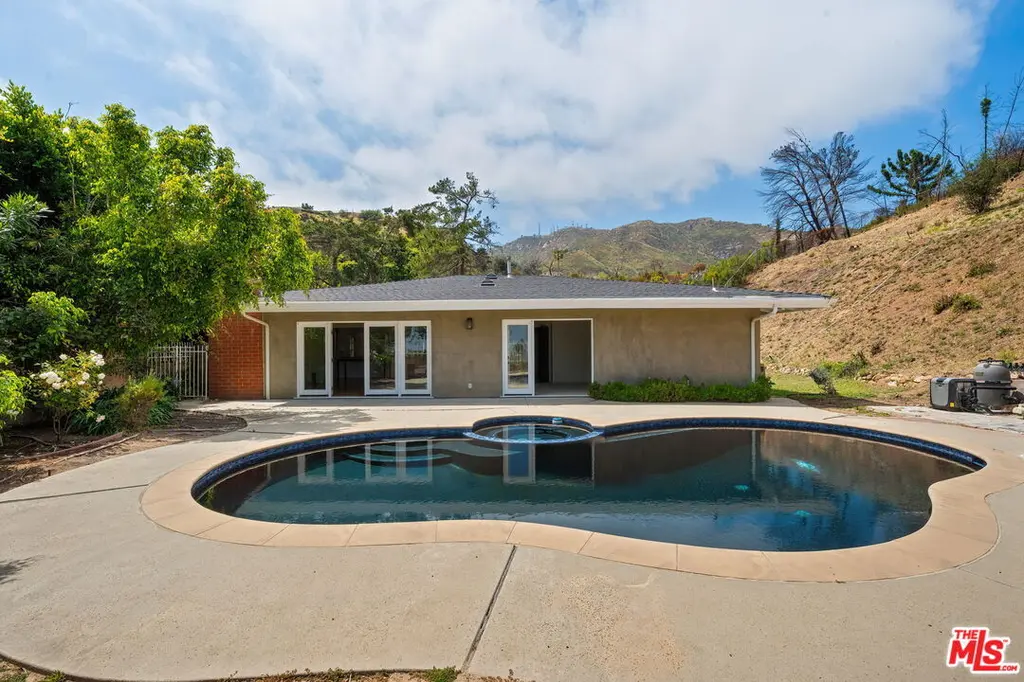
Rare opportunity. Gated, single story home, with sparkling pool & spa, situated on a secluded lot, surrounded by mature landscaping. Mountain and slight ocean views. Attached two-car garage. Eat-in kitchen. Dining area opens to the living room. Living room with hardwood floors & wood-burning fireplace. Updated master bath has separate shower & tub.
Key facts
- Open floor plan
- Flat backyard
- Pool
Tags
Property features AI
Finance
- Other: Zoning: LCA11*
Exterior
- Parking: 2-car garage; Driveway gate
- Home design: Detached single-family home; One level
- Construction: Detached / no common walls
- Exterior features: In-ground pool; Lot approximately 0.605 acres (163 x 160); No additional structures
Interior
- Kitchen: Dishwasher; Range/Oven; Refrigerator; Freezer
- Flooring: Wood floors; Carpeted floors
- Bathrooms: 2 full bathrooms
- Heating & cooling: Central heating; No cooling
- Interior features: Dining area; Open patio; Living room with built-ins; Fireplace in living room; Has ocean and mountain views; Sold 'As Is'
- Laundry & utility: Washer; Dryer; Laundry located in a closet
Neighborhood map
What this means for you Summary
Snapshot
- This is a 3-bed/2.0-bath single-family listed at $1.50M.
Deal economics
- At list price, monthly cash flow is $-730 ($-9k/yr) — negative.
- To cash-flow at today's rent, offer at most $1.37M (8.6% below list).
- To meet the 1% rule (rent ≥ 1% of price), the offer needs to be $1.09M (27.4% below list).
- Recommended offer: $1.09M (27.4% below list) — sets the bar for 1% rule.
- Cap rate 5.7% vs local median 0.7% in Malibu — top-decile yield for the area; either an underpriced asset or a hidden risk that comps aren't pricing in. Stress-test before assuming the spread holds.
Location & tenants
- Location reads 53/100 on livability (#979 in CA) — a working-class tenant base; expect higher turnover. Strengths: employment A+; Watch: housing C-, crime F, amenities F.
- Santa Monica-Malibu Unified (urban): math 61% / reading 74% proficiency, ranked #123 of 1,400 in CA (top 9%) — acceptable for families but not a draw, mixed tenant base, ~2y average lease.
- Zoned schools: Webster Elementary (214 students, 10% FRL).
- Market conditions: Rents falling (-3.4%/yr); 640 active listings in the ZIP; high-income renter base; 19,697 units permitted in Los Angeles County in 2024 (9,426 in 5+ unit buildings).
- At $10,885/mo this rent would consume 66% of the median local household income ($197k/yr) (locally 420% of renters already pay >50% of income on rent) — very limited rent-growth headroom before tenants either downsize or default.
Forward outlook
- In year one you build about $20k of equity ($10k loan paydown + $9k appreciation (0.6% local appreciation)).
- Los Angeles County population projected at +9% by 2050 — modest demand growth; plan on rents tracking national, not racing it.
- By year 5, paydown + projected appreciation supports a ~$96k cash-out refi (75% LTV) — recoverable capital for the next deal without selling this one.
Negotiation context
- Only 12 days on market — expect competitive offers; lowballing is unlikely to land.
- 7 sale attempts since 24y ago with the ask held roughly flat each time — persistent listings suggest the price (not the market) is what's stuck; bring a comps-based counter.
- Current owner paid $792k; list at $1.50M implies a 89% gain — meaningful room to come down on a strong offer.
Risks & watch-outs
- Climate carrying-cost: severe wildfire risk — expect insurance premiums to compound above CPI over the hold.
Questions for the listing agent
- What do current leases actually rent for vs. the listed asking? Can we see a recent rent roll and the last 12 months of T-12 income?
- Built in 1967 — when were the roof, HVAC, electrical panel, plumbing, and water heater last replaced?
- Is there a deadline driving the sale (1031 exchange, divorce, estate, relocation)? That informs how much negotiation room exists.
- Schools are B-rated — typically a magnet for longer-tenancy family renters. What's the average tenant stay here, and is there a school-zone premium baked into asking?
- Crime grade is F in this area — have there been break-ins, vandalism, or insurance claims at this property in the last 3 years? What carrier currently insures it and at what premium?
- The area grade is low — what's the realistic commute time and amenity access for the typical tenant pool here? Any planned neighborhood developments (good or bad) we should know about?
- What's the average days-on-market for RENTAL listings here right now (not sales)? A rising rental-DOM trend means longer vacancies and softer asking-rent achievability than the comps imply.
- What's the recent tenant-quality profile in this submarket — average credit score on applications, eviction rate, late-payment / NSF rate, and stable-employment percentage? A property-management company in the area should have these aggregated.
- How much new for-sale + rental construction is in the pipeline within 1–3 miles? Heavy new supply typically softens prices + rents 12–24 months out; constrained supply supports both.
Investment metrics
- 1% rule
- 0.73% ✗
- Cap rate
- 5.71%
- Cash-on-cash
- -2.09%
- DSCR
- 0.91
- GRM
- 11.5
CMA / ARV
No comps found within radius.
Projected returns pro-forma
0.62% appreciation · 0.0% rent growth · sell at horizon
- IRR
- -3.9%
- Equity multiple
- 0.81×
- Total profit
- $-78,642
- Equity at exit
- $482,151
- IRR
- -0.1%
- Equity multiple
- 0.99×
- Total profit
- $-5,735
- Equity at exit
- $618,449
Cash invested: $419,720 (down + closing). Projections, not guarantees.
Landlord ↔ Tenant lean methodology
- Overall (STATE)
- 18 Strongly Tenant-Friendly
- State California
- 18 Strongly Tenant-Friendly · D+13
- County
- — inherits STATE
- City
- — inherits STATE
ZIP-level market 90265
- Home prices YoY
- 0.1%
- Rents YoY
- -3.4%
- Active inventory
- 640
- Price-to-rent
- 11.5×
Monthly cashflow live
- Estimated rent
- $10,885 medium interval (Pro) →
- Mortgage (P&I)
- −$7,861
- Tax from tax record
- −$844 /mo · $10,125/yr
- Insurance
- −$625
- HOA
- −$0
- Lot rent
- −$0
- Vacancy / Maint / Mgmt
- −$2,286
- Net cashflow
- $-730
Break-even live
Sensitivity live
| Price | -10% $119 | -5% $-306 | +0% $-730 | +5% $-1,154 | +10% $-1,579 |
|---|---|---|---|---|---|
| Rent | -10% $-1,590 | -5% $-1,160 | +0% $-730 | +5% $-300 | +10% $130 |
| Rate | -1.0pp $25 | -0.5pp $-349 | base $-730 | +0.5pp $-1,118 | +1.0pp $-1,514 |
UW: 25.0% down · 7.5% · 30yr · 1.5% tax · 5.0% vac · 8.0% maint · 8.0% mgmt
Financing live
Cash to close
- Down payment
- $374,750
- Closing costs
- $44,970
- Reserves months
- —
- Total cash needed
- —
Loan-product check · same deal, 3 products live
Conventional
25% down · 7.5% · 30yr
- Down + closing
- —
- Monthly P&I
- —
- Monthly cashflow
- —
- DSCR
- —
- Eligible?
- —
Personal DTI + credit; lowest rate.
DSCR
20% down · 8.5% · 30yr
- Down + closing
- —
- Monthly P&I
- —
- Monthly cashflow
- —
- DSCR
- —
- Eligible?
- —
No personal income docs; deal must DSCR.
Hard money
10% down · 12.0% · 12mo
- Down + closing
- —
- Monthly P&I
- —
- Monthly cashflow
- —
- DSCR
- —
- Eligible?
- —
Short-term bridge; refi at stabilization.
Listing history 27 events
-
2026-06-03status $1,499,000 Pending 12 DOM
-
2026-06-02days on market $1,499,000 Active 12 DOM
-
2026-06-01days on market $1,499,000 Active 11 DOM
-
2026-05-31days on market $1,499,000 Active 10 DOM
-
2026-05-20$1,499,000 Active
-
2012-07-03soldstatus $792,000 Closed 368-char remark
Show marketing remark (368 chars)
Rare opportunity. Gated, single story home, with sparkling pool & spa, situated on a secluded lot, surrounded by mature landscaping. Mountain and slight ocean views. Attached two-car garage. Eat-in kitchen. Dining area opens to the living room. Living room with hardwood floors & wood-burning fireplace. Updated master bath has separate shower & tub.
-
2012-06-29status Pending 368-char remark
Show marketing remark (368 chars)
Rare opportunity. Gated, single story home, with sparkling pool & spa, situated on a secluded lot, surrounded by mature landscaping. Mountain and slight ocean views. Attached two-car garage. Eat-in kitchen. Dining area opens to the living room. Living room with hardwood floors & wood-burning fireplace. Updated master bath has separate shower & tub.
-
2012-03-11status Backup Offers Accepted 368-char remark
Show marketing remark (368 chars)
Rare opportunity. Gated, single story home, with sparkling pool & spa, situated on a secluded lot, surrounded by mature landscaping. Mountain and slight ocean views. Attached two-car garage. Eat-in kitchen. Dining area opens to the living room. Living room with hardwood floors & wood-burning fireplace. Updated master bath has separate shower & tub.
-
2012-02-16$785,000 Active 368-char remark
Show marketing remark (368 chars)
Rare opportunity. Gated, single story home, with sparkling pool & spa, situated on a secluded lot, surrounded by mature landscaping. Mountain and slight ocean views. Attached two-car garage. Eat-in kitchen. Dining area opens to the living room. Living room with hardwood floors & wood-burning fireplace. Updated master bath has separate shower & tub.
-
2012-02-10historical Cancelled
-
2011-10-04status Backup Offers Accepted
-
2011-08-12price
-
2011-04-11price
-
2011-03-07price
-
2011-01-20price
-
2010-10-20Active
-
2009-08-26historical
-
2009-07-28Active
-
2006-10-05historical
-
2006-10-02
-
2005-01-28soldstatus $1,260,010
-
2004-11-18historical
-
2004-10-30
-
2003-01-22soldstatus $695,000
-
2002-11-15historical
-
2002-10-03$695,000
-
1990-07-02soldstatus $595,000
ⓘ Source: listings_history table (triggers on properties + properties_extension) + one-shot
backfill from property_details.listing_events for pre-trigger history.
Tax reassessment forecast CA · Resets to sale price
- Current annual tax
- $10,125 · $844/mo
- Projected year-2 tax
- $11,392 · $949/mo
- Expected delta
- +$1,267/yr (+$106/mo · 12.5%)
ⓘ Screening estimate from a state-policy table — verify with the county assessor before closing.
Climate risk First Street
- Flood 1/10 Low FEMA zone D · 0% chance over 30 yrs
- Wildfire 8/10 Severe
- Heat 4/10 Moderate 7 d/yr ≥83°F today · 19 d/yr by 30 yrs out
- Wind 1/10 Low
- Air quality 5/10 Major 6 unhealthy d/yr today · 8 by 30 yrs out
Nearby sold comps map
Loading sold comps map…
Walkable amenities ~0.75 mi
Loading nearby amenities…
Taxation est. · year 1
- Rental income
- $130,621
- − Mortgage interest
- −$83,967
- − Property taxes
- −$10,125
- − Insurance
- −$7,495
- − Repairs & maintenance
- −$10,450
- − Management
- −$10,450
- − Depreciation
- −$43,607
- Taxable loss
- −$35,473
- Est. tax savings @ 24.0%
- +$8,514
- After-tax cash flow
- $-247/yr
For passive investors: Depreciation is non-cash, so a rental often shows a tax loss while cash-flowing — sheltering income. Rental losses are passive: they offset passive income freely, and up to $25,000/yr can offset ordinary (W-2) income if you actively participate and your MAGI is under $100k (phasing out to $0 by $150k); unused losses carry forward. On sale, claimed depreciation is recaptured at up to 25%, and gains may owe capital-gains tax (a 1031 exchange can defer both). Figures are a year-1 estimate at your 24.0% rate — not tax advice; consult a CPA.
Schools (NCES district)
- District
- Santa Monica-Malibu Unified
- NCES district ID
- 0635700
- Math proficiency
- 61% ▬ 0.00%
- Reading proficiency
- 74% ▬ 0.00%
- Median HH income
- $81,489
- Composite
- 61.58/100
- National rank
- #1535
- State rank
- #123 of 1400 in CA
Livability — Malibu
- Score
- 53/100
- State rank
- #979
- US rank
- #24630
Category grades
Schools grade is shown separately in the Schools card above.
Census & demographics
- County
- Los Angeles County · 9,444,647 people
- City population
- 15,918
- Metro
- Los Angeles-Long Beach-Anaheim, CA
- Population (ZIP)
- 15,918
- Household income
- $196,742
- Rent vs Own
- Severe rent burden
- 420.0
Population outlook (Los Angeles County) Hauer SSP2
- Today (2025)
- 10,940,515 people
- By 2030
- 11,256,481 · +2.9%
- By 2040
- 11,729,929 · +7.2%
- By 2050
- 11,948,407 · +9.2%
- By 2075
- 11,818,114 · +8.0%
- By 2100
- 10,842,928 · -0.9%
Race, ethnicity, and origin ACS 2023
- Neighborhood character
- Predominantly White (77%)
- Race & ethnicity
- White 77% Two or more races 10% Hispanic / Latino 9% Asian 5% Black 1%
- Hispanic origin (detail)
- Mexican 6%
- Common ancestry
- Italian 8% Scotch-Irish 3% Romanian 3%
- Foreign-born
- 16% · Canada, South Korea, China
- Languages at home
- 82% English-only · Spanish 6% Other Indo-European 6% French/Haitian/Cajun 2%
Political lean MEDSL · Los Angeles
- 2024 margin
- Solid D (+32.9) · D 64.8% · R 31.9% · Other 3.3%
- 2008→2024 swing
- -7.4pp toward R · 2008: 40.4pp · 2024: 32.9pp
- All cycles
- 2024: D+32.9 2020: D+44.2 2016: D+48.0 2012: D+40.0 2008: D+40.4
Not yet ingested
- Civics
- —
Market trends
- HPI YoY
- ▲ 0.62%
- Current HPI
- 498.5117
- Rent YoY
- ▼ -3.39%
- Metro
- Los Angeles-Long Beach-Anaheim, CA
- State GDP YoY
- ▲ 3.21%
- F500 in state
- 116
Industry mix (Fortune 500 HQ in CA)
| Industry | F500 HQs | Revenue |
|---|---|---|
| Technology | 27 | $1,492B |
|
||
| Financial Services | 3 | $174B |
|
||
| Retail | 3 | $44B |
|
||
| Insurance | 3 | $26B |
|
||
| Media / Entertainment | 2 | $115B |
|
||
| Pharmaceuticals / Biotech | 2 | $62B |
|
||
Price history
+151.9% since first listed24 events — show timeline
- 2026-06-02 Pending — TheMLS
- 2026-05-20 Listed $1,499,000 TheMLS
- 2012-07-03 Sold (MLS) $792,000 TheMLS
- 2012-06-29 Pending — TheMLS
- 2012-03-11 Pending — TheMLS
- 2012-02-16 Listed $785,000 TheMLS
- 2012-02-10 Delisted — TheMLS
- 2011-10-04 Pending — TheMLS
- 2011-08-12 Price Changed — TheMLS
- 2011-04-11 Price Changed — TheMLS
- 2011-03-07 Price Changed — TheMLS
- 2011-01-20 Price Changed — TheMLS
- 2010-10-20 Listed — TheMLS
- 2009-08-26 Delisted — TheMLS
- 2009-07-28 Listed — TheMLS
- 2006-10-05 Delisted — TheMLS
- 2006-10-02 Listed — TheMLS
- 2005-01-28 Sold (Public Records) $1,260,010 Public Records
- 2004-11-18 Delisted — TheMLS
- 2004-10-30 Listed — TheMLS
- 2003-01-22 Sold (MLS) $695,000 TheMLS
- 2002-11-15 Delisted — TheMLS
- 2002-10-03 Listed $695,000 TheMLS
- 1990-07-02 Sold (Public Records) $595,000 Public Records
Property tax history
-2.4%/yrLatest (2025): $10,125 · -15.0% YoY. Source: county tax records.
Cash-flow waterfall
monthlySold comps — $/sqft
last 12 mo · ≤1 miLoading sold comps…