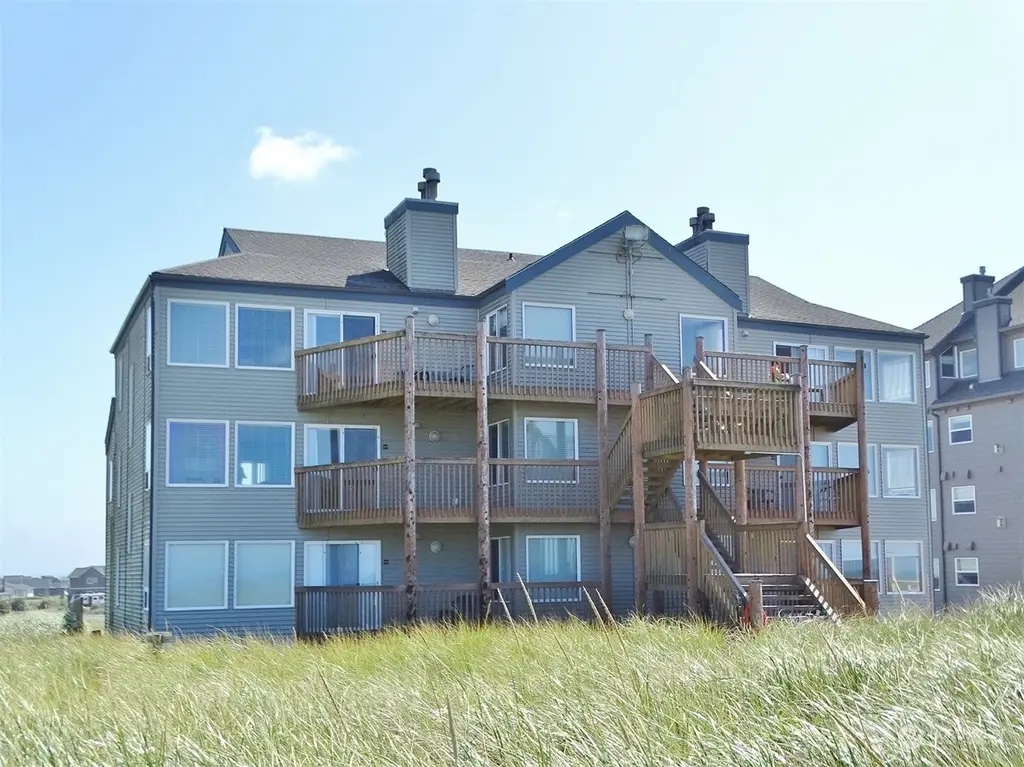
1399 Ocean Shores Blvd SW Unit 2N-E
Ocean Shores, WA 98569
$5,000D-
2 bd · 2.0 ba ·
1,100 sqft ·
Built 1985
· Timeshare
· Active
· 582 DOM
Cashflow @ list (25.0% down · 7.5%)
Estimated rent
$1,632/mo
Mortgage (P&I)
−$26
Tax + insurance
−$677
HOA
−$245
Vac / Maint / Mgmt
−$343
Net cashflow
$341/mo
Annual
$4,087/yr
Cap rate
248.58%
Cash-on-cash
865.32%
DSCR
39.50
1% rule
32.64%
Cash to close
$1,400
Investor read
- This is a 2-bed/2.0-bath timeshare listed at $5k.
- At list price, monthly cash flow is $341 ($4k/yr) — positive.
- The deal already cash-flows at list — no discount required.
- Meets the 1% rule at list price ($2k rent vs $5k).
- It's been on market 582 days — a 12% lower offer ($4k) is reasonable based on typical stale-listing flexibility.
- Recommended offer: $4k (12.0% below list) — sets the bar for market timing.
- Local home prices are declining (-3.0%/yr); year-one equity from $35 of loan paydown is wiped out by about $150 of value loss. Plan a longer hold.
- Location reads 62/100 on livability (#424 in WA) — a middle-class / working-renter tenant base. Strengths: housing A; Watch: schools C-, crime C-, health & safety C-.
- North Beach School District (rural): math 32% / reading 44% proficiency, ranked #236 of 291 in WA (top 81%) — families likely to look elsewhere, expect single-tenant / working-renter base with shorter leases; 63% free/reduced lunch — lower-income household profile, screen leases tightly.
- Watch-outs: flood insurance adds $669/mo.
- Market conditions: 653 active listings in the ZIP; 297 units permitted in Grays Harbor County in 2024 (17 in 5+ unit buildings).
- Grays Harbor County population projected at -24% by 2050 — secular population decline; favor cash flow + early exit over multi-decade hold.
- 3 sale attempts since 4y ago; this cycle's ask has dropped $5k (50%) from the opening price — seller is motivated, your offer sets the floor, not the list.
- Current owner paid $4k; 43% above their basis — modest negotiation headroom, anchor on the comps not their cost.
- At projected returns (-3.0% appreciation + 3.0% rent growth), your $1k cash investment doubles in ~1 year — after that, you're playing with house money.
- Climate carrying-cost: in FEMA flood zone VE (mandatory federal flood insurance) — expect insurance premiums to compound above CPI over the hold.
- Cap rate 248.6% vs local median 3.1% in Ocean Shores — top-decile yield for the area; either an underpriced asset or a hidden risk that comps aren't pricing in. Stress-test before assuming the spread holds.
- This rent runs 34% of the median local income ($58k/yr) — at the standard rent-burdened threshold; future hikes will face affordability resistance.
Questions for listing agent
- It's been on market 582 days. Have you received any prior offers? Is the seller open to a 12% concession, seller financing, or rate buy-down credit?
- What's the actual annual flood-insurance premium (NFIP or private), and is the property in a SFHA with mandatory coverage?
- What does the HOA fee cover, when was the last increase, and are there any pending special assessments or reserve-fund shortfalls?
- Why hasn't it sold? Are there any deal-killer items the seller is aware of (foundation, flood, title, zoning, code violations)?
- Is there a deadline driving the sale (1031 exchange, divorce, estate, relocation)? That informs how much negotiation room exists.
- The area grade is low — what's the realistic commute time and amenity access for the typical tenant pool here? Any planned neighborhood developments (good or bad) we should know about?
- What's the average days-on-market for RENTAL listings here right now (not sales)? A rising rental-DOM trend means longer vacancies and softer asking-rent achievability than the comps imply.
- What's the recent tenant-quality profile in this submarket — average credit score on applications, eviction rate, late-payment / NSF rate, and stable-employment percentage? A property-management company in the area should have these aggregated.
CashFlowRE · CFR-EH5ZFP4FCT80P9
· Data 1 week ago
cashflowre.app · 2026-05-29