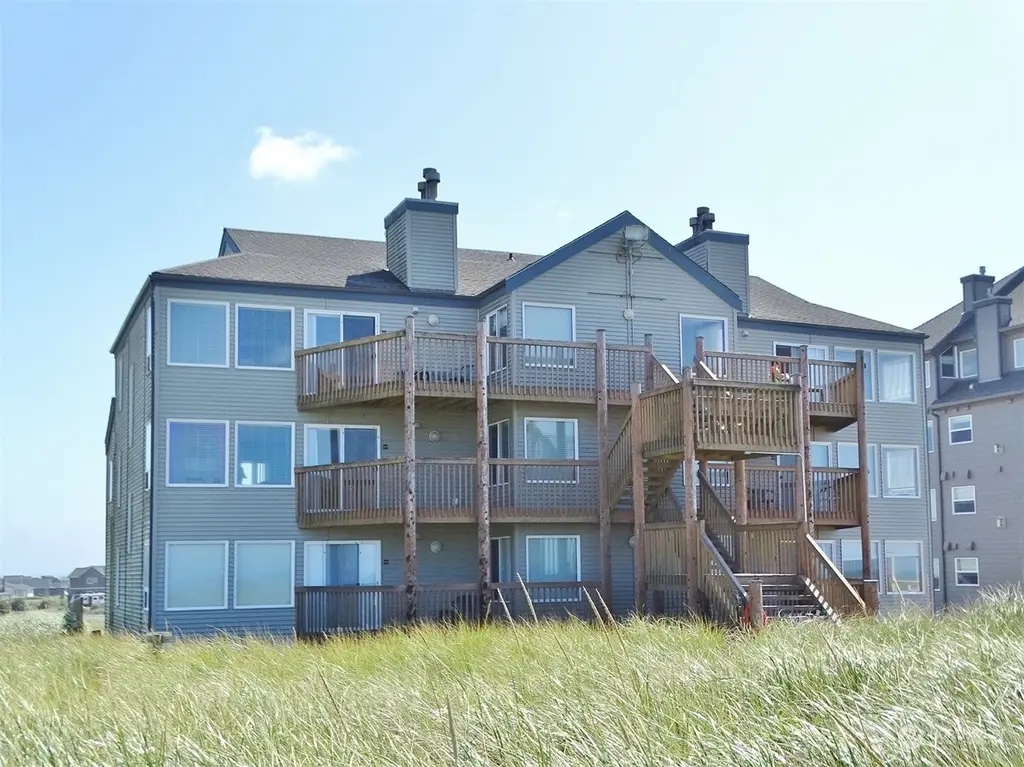
1399 Ocean Shores Blvd SW Unit 2N-E · Ocean Shores, WA
Flood risk 1/10 · Minimal
- FEMA flood zone
- VE
- Chance of flooding over 30 yrs
- 0.0%
- Est. flood insurance / yr
- $5,013 – $11,043
Fire risk 1/10 · Minimal
- Est. fire insurance / yr
- $604 – $1,122
Heat risk 1/10 · Minimal
- Hot days now (above 72°F)
- 7 days/yr
- Hot days in 30 yrs
- 18 days/yr
Wind risk 1/10 · Minimal
- Chance of severe wind over 30 yrs
- —
Air-quality risk 5/10 · Moderate
- Unhealthy air days now
- 6 days/yr
- Unhealthy air days in 30 yrs
- 6 days/yr
Risk factors via First Street. Map © Google.
Why this score? — see what drove the D- grade
The composite is a weighted blend of 9 inputs, each scored 0–100. Each bar is that input's sub-score; the figure is the points it added to the 100-point composite (weight × sub-score).
- Cash flow +15.0/30.0
- 1% rule +5.0/10.0
- DSCR +5.0/10.0
- Schools +3.4/10.0
- Livability +3.1/5.0
- Rent growth +2.5/5.0
- Condition / age +2.5/5.0
- ARV discount +0.4/15.0
- Appreciation +0.0/10.0
$5,000
🖨 Deal sheet 📄 Offer letter ✓ Due diligence
Listing remarks
OCEAN FRONT/VIEW Deeded Shares TIMESHARE! 2nd-floor, north-side unit #2N in Pacific Avenue. Featuring 2 BD, 2 BA, 1100 sq. ft. with Decks in the front (East) and rear (West). Comfortable Living/Dining Area with beautiful Ocean and Jetty views. Fully-equipped Kitchen with Eating Bar and Classic Wood Ceilings. Primary Bedroom with king-sized bed and Ocean views! Bedroom #2 has a full bed and twin bed. Stackable washer/dryer. Sleeps up to 5 people. Use up to 5 date-specific weeks/year ~ Desirable Week "E": Valentine's Day some years, April/May, July 4th some years, Thanksgiving Day some years. Pacific Avenue has an on-site shared jacuzzi; and owners have access to all of the Communit
Key facts
- Ocean front view
- Parking
- Built 1985
Tags
Neighborhood map
What this means for you Summary
Snapshot
- This is a 2-bed/2.0-bath timeshare listed at $5k.
Deal economics
- At list price, monthly cash flow is $341 ($4k/yr) — positive.
- The deal already cash-flows at list — no discount required.
- Meets the 1% rule at list price ($2k rent vs $5k).
- Recommended offer: $4k (12.0% below list) — sets the bar for market timing.
- Cap rate 248.6% vs local median 3.1% in Ocean Shores — top-decile yield for the area; either an underpriced asset or a hidden risk that comps aren't pricing in. Stress-test before assuming the spread holds.
Location & tenants
- Location reads 62/100 on livability (#424 in WA) — a middle-class / working-renter tenant base. Strengths: housing A; Watch: schools C-, crime C-, health & safety C-.
- North Beach School District (rural): math 32% / reading 44% proficiency, ranked #236 of 291 in WA (top 81%) — families likely to look elsewhere, expect single-tenant / working-renter base with shorter leases; 63% free/reduced lunch — lower-income household profile, screen leases tightly.
- Market conditions: 653 active listings in the ZIP; 297 units permitted in Grays Harbor County in 2024 (17 in 5+ unit buildings).
- This rent runs 34% of the median local income ($58k/yr) — at the standard rent-burdened threshold; future hikes will face affordability resistance.
Forward outlook
- Local home prices are declining (-3.0%/yr); year-one equity from $35 of loan paydown is wiped out by about $150 of value loss. Plan a longer hold.
- Grays Harbor County population projected at -24% by 2050 — secular population decline; favor cash flow + early exit over multi-decade hold.
- At projected returns (-3.0% appreciation + 3.0% rent growth), your $1k cash investment doubles in ~1 year — after that, you're playing with house money.
Negotiation context
- It's been on market 582 days — a 12% lower offer ($4k) is reasonable based on typical stale-listing flexibility.
- 3 sale attempts since 4y ago; this cycle's ask has dropped $5k (50%) from the opening price — seller is motivated, your offer sets the floor, not the list.
- Current owner paid $4k; 43% above their basis — modest negotiation headroom, anchor on the comps not their cost.
Risks & watch-outs
- Watch-outs: flood insurance adds $669/mo.
- Climate carrying-cost: in FEMA flood zone VE (mandatory federal flood insurance) — expect insurance premiums to compound above CPI over the hold.
Questions for the listing agent
- It's been on market 582 days. Have you received any prior offers? Is the seller open to a 12% concession, seller financing, or rate buy-down credit?
- What's the actual annual flood-insurance premium (NFIP or private), and is the property in a SFHA with mandatory coverage?
- What does the HOA fee cover, when was the last increase, and are there any pending special assessments or reserve-fund shortfalls?
- Why hasn't it sold? Are there any deal-killer items the seller is aware of (foundation, flood, title, zoning, code violations)?
- Is there a deadline driving the sale (1031 exchange, divorce, estate, relocation)? That informs how much negotiation room exists.
- The area grade is low — what's the realistic commute time and amenity access for the typical tenant pool here? Any planned neighborhood developments (good or bad) we should know about?
- What's the average days-on-market for RENTAL listings here right now (not sales)? A rising rental-DOM trend means longer vacancies and softer asking-rent achievability than the comps imply.
- What's the recent tenant-quality profile in this submarket — average credit score on applications, eviction rate, late-payment / NSF rate, and stable-employment percentage? A property-management company in the area should have these aggregated.
- How much new for-sale + rental construction is in the pipeline within 1–3 miles? Heavy new supply typically softens prices + rents 12–24 months out; constrained supply supports both.
Investment metrics
- 1% rule
- 32.64% ✓
- Cap rate
- 248.58%
- Cash-on-cash
- 865.32%
- DSCR
- 39.50
- GRM
- 0.3
CMA / ARV
- ARV (median comp)
- $4,321
- List price
- $5,000
- Delta
- 15.71%
- Verdict
- OVERPRICED
- Comps
- 20 within 1.0 mi
Show comp detail 8 sales within ~0.75 mi
| Address | Dist | Beds/Ba | Sqft | Sold | Price | $/sf | Match |
|---|---|---|---|---|---|---|---|
| 1399 Ocean Shores Blvd SW Unit 3S-D | 0.00mi | 2/2.0 | 1,100 (0%) | 10mo | $10,000 | $9 | 92 |
| 1399 Ocean Shores Blvd SW Unit 3N-J | 0.00mi | 2/2.0 | 1,100 (0%) | 18mo | $9,000 | $8 | 85 |
| 1399 Ocean Shores Blvd SW Unit 3N-D | 0.00mi | 2/2.0 | 1,100 (0%) | 20mo | $10,000 | $9 | 83 |
| 1407 Ocean Shores Blvd SW Unit 3S-E | 0.03mi | 2/2.0 | 950 (-14%) | 4mo | $4,500 | $5 | 72 |
| 1407 Ocean Shores Blvd SW Unit 1N-I | 0.03mi | 2/2.0 | 950 (-14%) | 8mo | $3,000 | $3 | 69 |
| 1407 Ocean Shores Blvd SW Unit 2S-I | 0.03mi | 2/2.0 | 950 (-14%) | 13mo | $2,500 | $3 | 65 |
| 1407 Ocean Shores Blvd SW Unit 2S-B | 0.03mi | 2/2.0 | 950 (-14%) | 18mo | $4,000 | $4 | 61 |
| 1407 Ocean Shores Blvd SW Unit 1S-H | 0.03mi | 2/2.0 | 950 (-14%) | 19mo | $2,250 | $2 | 60 |
Match score weights: distance 35% · size 25% · config 20% · recency 20%. Top-matched comps best support the ARV.
Projected returns pro-forma
-3.0% appreciation · 3.0% rent growth · sell at horizon
- IRR
- —
- Equity multiple
- 16.33×
- Total profit
- $21,466
- Equity at exit
- $746
- IRR
- —
- Equity multiple
- 36.00×
- Total profit
- $49,002
- Equity at exit
- $432
Cash invested: $1,400 (down + closing). Projections, not guarantees.
Landlord ↔ Tenant lean methodology
- Overall (STATE)
- 28 Tenant-Leaning
- State Washington
- 28 Tenant-Leaning · D+8
- County
- — inherits STATE
- City
- — inherits STATE
ZIP-level market 98569
- Home prices YoY
- -3.4%
- Active inventory
- 653
- Price-to-rent
- 0.3×
Monthly cashflow live
- Estimated rent
- $1,632 medium interval (Pro) →
- Mortgage (P&I)
- −$26
- Tax est. 1.5%
- −$6 /mo · $75/yr
- Insurance
- −$2
- Flood insurance flood zone
- −$669 /mo · $8,028/yr
- HOA
- −$245
- Vacancy / Maint / Mgmt
- −$343
- Net cashflow
- $341
Break-even live
UW: 25.0% down · 7.5% · 30yr · 1.5% tax · 5.0% vac · 8.0% maint · 8.0% mgmt
Financing live
Cash to close
- Down payment
- $1,250
- Closing costs
- $150
- Reserves months
- —
- Total cash needed
- —
Loan-product check · same deal, 3 products live
Conventional
25% down · 7.5% · 30yr
- Down + closing
- —
- Monthly P&I
- —
- Monthly cashflow
- —
- DSCR
- —
- Eligible?
- —
Personal DTI + credit; lowest rate.
DSCR
20% down · 8.5% · 30yr
- Down + closing
- —
- Monthly P&I
- —
- Monthly cashflow
- —
- DSCR
- —
- Eligible?
- —
No personal income docs; deal must DSCR.
Hard money
10% down · 12.0% · 12mo
- Down + closing
- —
- Monthly P&I
- —
- Monthly cashflow
- —
- DSCR
- —
- Eligible?
- —
Short-term bridge; refi at stabilization.
HOA detail
- Monthly dues
- $245 · $2,940/yr
Listing history 16 events
-
2026-06-12days on market $5,000 Active 582 DOM
-
2026-06-09days on market $5,000 Active 579 DOM
-
2026-06-08days on market $5,000 Active 578 DOM
-
2026-06-07days on market $5,000 Active 577 DOM
-
2026-06-05days on market $5,000 Active 574 DOM
-
2026-06-03days on market $5,000 Active 573 DOM
-
2026-06-02days on market $5,000 Active 572 DOM
-
2026-06-01days on market $5,000 Active 571 DOM
-
2026-05-31days on market $5,000 Active 570 DOM
-
2026-05-30days on market $5,000 Active 569 DOM
-
2025-06-13status Active
-
2025-01-08price $8,500
-
2024-10-31$10,000 Active
-
2022-08-01soldstatus $3,500 Closed
-
2022-06-15status Pending
-
2022-06-13$3,500 Active
ⓘ Source: listings_history table (triggers on properties + properties_extension) + one-shot
backfill from property_details.listing_events for pre-trigger history.
Climate risk First Street
- Flood 1/10 Low FEMA zone VE · 0% chance over 30 yrs
- Wildfire 1/10 Low
- Heat 1/10 Low 7 d/yr ≥72°F today · 18 d/yr by 30 yrs out
- Wind 1/10 Low
- Air quality 5/10 Major 6 unhealthy d/yr today · 6 by 30 yrs out
Nearby sold comps map
Loading sold comps map…
Walkable amenities ~0.75 mi
Loading nearby amenities…
Taxation est. · year 1
- Rental income
- $19,581
- − Mortgage interest
- −$280
- − Property taxes
- −$75
- − Insurance
- −$8,053
- − Repairs & maintenance
- −$1,566
- − Management
- −$1,566
- − HOA
- −$2,940
- − Depreciation
- −$145
- Taxable income
- $4,955
- Est. tax owed @ 24.0%
- −$1,189
- After-tax cash flow
- $2,897/yr
For passive investors: Depreciation is non-cash, so a rental often shows a tax loss while cash-flowing — sheltering income. Rental losses are passive: they offset passive income freely, and up to $25,000/yr can offset ordinary (W-2) income if you actively participate and your MAGI is under $100k (phasing out to $0 by $150k); unused losses carry forward. On sale, claimed depreciation is recaptured at up to 25%, and gains may owe capital-gains tax (a 1031 exchange can defer both). Figures are a year-1 estimate at your 24.0% rate — not tax advice; consult a CPA.
Schools (NCES district)
- District
- North Beach School District
- NCES district ID
- 5305700
- Math proficiency
- 32% ▼ -4.00%
- Reading proficiency
- 44% ▬ 0.00%
- Median HH income
- $40,966
- Composite
- 34.46/100
- National rank
- #10153
- State rank
- #236 of 291 in WA
Livability — Ocean Shores
- Score
- 62/100
- State rank
- #424
- US rank
- #16852
Category grades
Schools grade is shown separately in the Schools card above.
Census & demographics
- Census place
- Ocean Shores, WA
- County
- Grays Harbor County · 44,693 people
- City population
- 7,187
- Metro
- Aberdeen, WA
- Population (ZIP)
- 7,489
- Household income
- $58,378
- Rent vs Own
- Severe rent burden
- 172.0
Population outlook (Grays Harbor County) Hauer SSP2
- Today (2025)
- 66,443 people
- By 2030
- 63,255 · -4.8%
- By 2040
- 56,466 · -15.0%
- By 2050
- 50,516 · -24.0%
- By 2075
- 39,296 · -40.9%
- By 2100
- 31,142 · -53.1%
Race, ethnicity, and origin ACS 2023
- Neighborhood character
- Predominantly White (86%)
- Race & ethnicity
- White 86% Two or more races 5% Hispanic / Latino 4% Asian 3% Native American 3%
- Common ancestry
- Portuguese 8% Iranian 5% Lithuanian 4%
- Foreign-born
- 5% · Canada
- Languages at home
- 92% English-only · Spanish 3% Tagalog/Filipino 2% German/W. Germanic 2%
Political lean MEDSL · Grays Harbor
- 2024 margin
- Lean R (+6.0) · D 45.6% · R 51.6% · Other 2.8%
- 2008→2024 swing
- -20.6pp toward R · 2008: 14.6pp · 2024: -6.0pp
- All cycles
- 2024: R+6.0 2020: R+6.6 2016: R+7.1 2012: D+14.0 2008: D+14.6
Not yet ingested
- Civics
- —
Market trends
- HPI YoY
- ▼ -13.33%
- Current HPI
- 380.05
- Rent YoY
- —
- Metro
- Aberdeen, WA
- State GDP YoY
- ▲ 4.65%
- F500 in state
- 22
Industry mix (Fortune 500 HQ in WA)
| Industry | F500 HQs | Revenue |
|---|---|---|
| Retail | 2 | $269B |
|
||
| Technology / Retail | 1 | $638B |
|
||
| Technology | 1 | $245B |
|
||
| Telecommunications | 1 | $38B |
|
||
| Food / Beverage | 1 | $36B |
|
||
| Automotive / Trucks | 1 | $34B |
|
||
Price history
+142.9% since first listed6 events — show timeline
- 2025-06-13 Relisted — NWMLS as Distributed by MLS Grid
- 2025-01-08 Price Changed $8,500 NWMLS as Distributed by MLS Grid
- 2024-10-31 Listed $10,000 NWMLS as Distributed by MLS Grid
- 2022-08-01 Sold (MLS) $3,500 NWMLS as Distributed by MLS Grid
- 2022-06-15 Pending — NWMLS as Distributed by MLS Grid
- 2022-06-13 Listed $3,500 NWMLS as Distributed by MLS Grid
Cash-flow waterfall
monthlySold comps — $/sqft
last 12 mo · ≤1 miLoading sold comps…