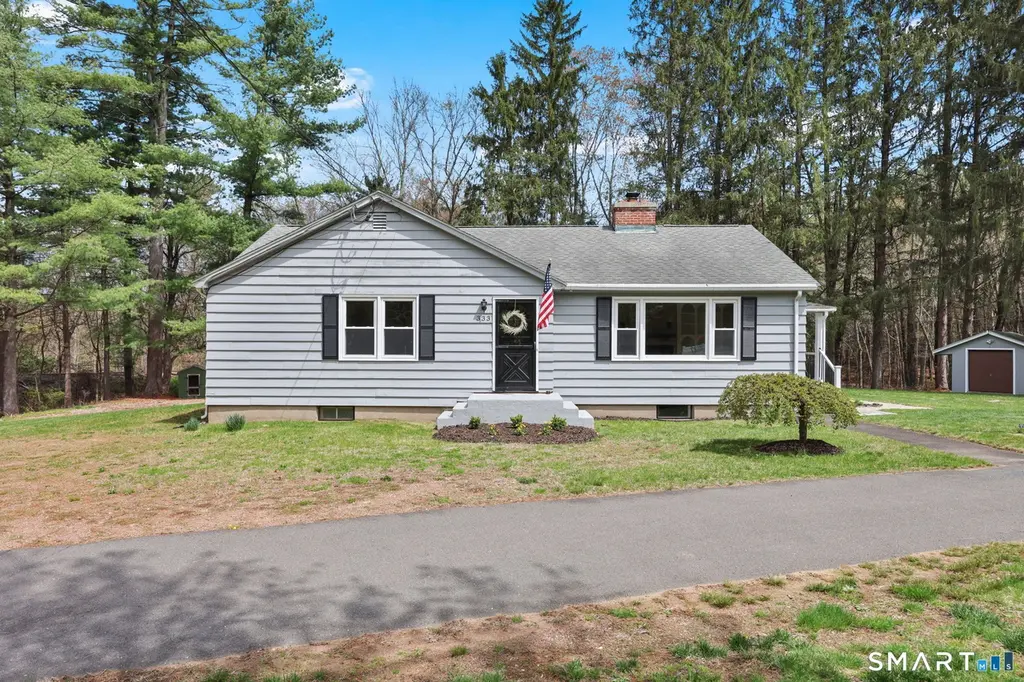
333 Troy Rd
Broad Brook, CT 06074
$349,900D-
2 bd · 1.0 ba ·
1,194 sqft ·
Built 1955
· SingleFamily
· Under Contract
· 8 DOM
Cashflow @ list (25.0% down · 7.5%)
Estimated rent
$2,319/mo
Mortgage (P&I)
−$1,835
Tax + insurance
−$588
HOA
−$0
Vac / Maint / Mgmt
−$487
Net cashflow
$-591/mo
Annual
$-7,095/yr
Cap rate
4.27%
Cash-on-cash
-7.24%
DSCR
0.68
1% rule
0.66%
Cash to close
$97,972
Investor read
- This is a 2-bed/1.0-bath single-family listed at $350k.
- At list price, monthly cash flow is $-591 ($-7k/yr) — negative.
- To cash-flow at today's rent, offer at most $245k (29.8% below list).
- To meet the 1% rule (rent ≥ 1% of price), the offer needs to be $232k (33.7% below list).
- Only 8 days on market — expect competitive offers; lowballing is unlikely to land.
- Recommended offer: $232k (33.7% below list) — sets the bar for 1% rule.
- Local home prices are declining (-3.0%/yr); year-one equity from $2k of loan paydown is wiped out by about $10k of value loss. Plan a longer hold.
- Location reads 73/100 on livability (#71 in CT) — a middle-class / working-renter tenant base. Strengths: crime A+, housing A+, employment A; Watch: amenities F, commute F.
- South Windsor School District (suburban): math 60% / reading 69% proficiency, ranked #27 of 153 in CT (top 18%) — acceptable for families but not a draw, mixed tenant base, ~2y average lease; only 9% free/reduced lunch — higher-income household profile.
- Zoned schools: Eli Terry School (math 52% / reading 56%, grade C, #207 of 553 statewide, top 38%, 505 students, 18% FRL); South Windsor High School (math 55% / reading 72%, grade B-, #38 of 194 statewide, top 19%, 1,329 students, 17% FRL).
- Watch-outs: built in 1955 — expect roof / HVAC / electrical / plumbing capex.
- Market conditions: Rents rising (+2.8%/yr); 119 active listings in the ZIP; high-income renter base; 1,867 units permitted in Capitol Planning Region in 2024 (1,399 in 5+ unit buildings).
- 6 sale attempts since 24y ago with the ask held roughly flat each time — persistent listings suggest the price (not the market) is what's stuck; bring a comps-based counter.
- Cap rate 4.3% vs local median 2.7% in Broad Brook — top-decile yield for the area; either an underpriced asset or a hidden risk that comps aren't pricing in. Stress-test before assuming the spread holds.
Questions for listing agent
- What do current leases actually rent for vs. the listed asking? Can we see a recent rent roll and the last 12 months of T-12 income?
- Built in 1955 — when were the roof, HVAC, electrical panel, plumbing, and water heater last replaced?
- Is there a deadline driving the sale (1031 exchange, divorce, estate, relocation)? That informs how much negotiation room exists.
- Schools are D-rated, which usually means shorter tenancies and higher turnover. Who's the typical renter profile here, and what's been the actual vacancy rate?
- The area grade is low — what's the realistic commute time and amenity access for the typical tenant pool here? Any planned neighborhood developments (good or bad) we should know about?
- What's the average days-on-market for RENTAL listings here right now (not sales)? A rising rental-DOM trend means longer vacancies and softer asking-rent achievability than the comps imply.
- What's the recent tenant-quality profile in this submarket — average credit score on applications, eviction rate, late-payment / NSF rate, and stable-employment percentage? A property-management company in the area should have these aggregated.
- How much new for-sale + rental construction is in the pipeline within 1–3 miles? Heavy new supply typically softens prices + rents 12–24 months out; constrained supply supports both.
CashFlowRE · CFR-EHD96QDBTEV7GH
· Data 3 weeks ago
cashflowre.app · 2026-05-29