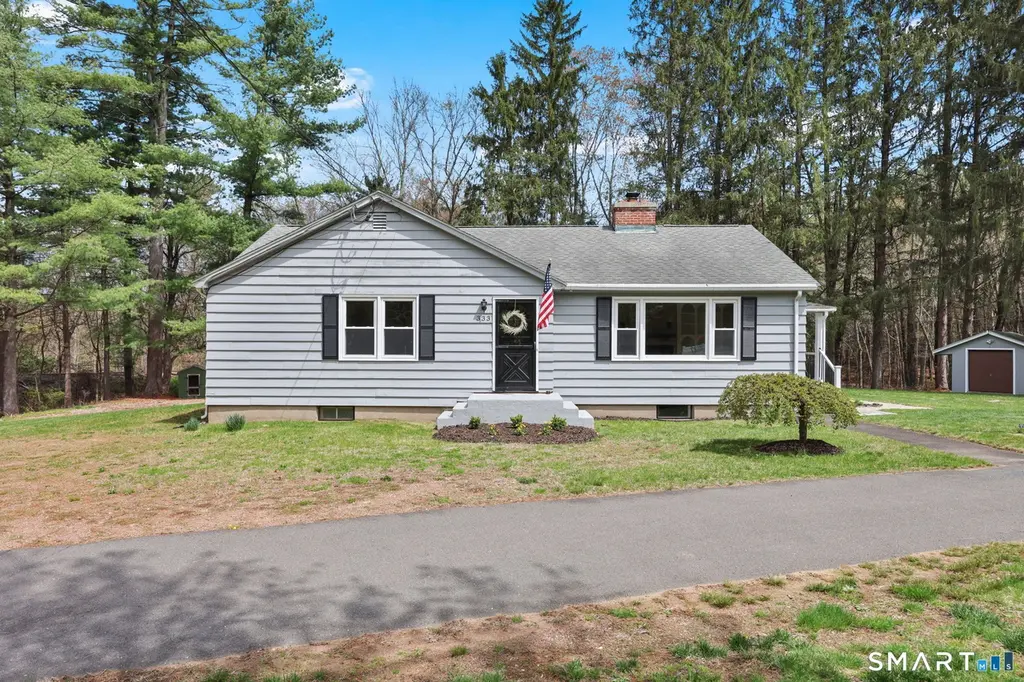
333 Troy Rd · Broad Brook, CT
Flood risk No data
- FEMA flood zone
- —
- Chance of flooding over 30 yrs
- —
- Est. flood insurance / yr
- —
Fire risk No data
- Est. fire insurance / yr
- —
Heat risk No data
- Hot days now (above threshold)
- —
- Hot days in 30 yrs
- —
Wind risk No data
- Chance of severe wind over 30 yrs
- —
Air-quality risk No data
- Unhealthy air days now
- —
- Unhealthy air days in 30 yrs
- —
Risk factors via First Street. Map © Google.
Why this score? — see what drove the D- grade
The composite is a weighted blend of 9 inputs, each scored 0–100. Each bar is that input's sub-score; the figure is the points it added to the 100-point composite (weight × sub-score).
- ARV discount +12.2/15.0
- Cash flow +6.5/30.0
- Schools +5.9/10.0
- Livability +3.7/5.0
- Rent growth +3.2/5.0
- Condition / age +2.5/5.0
- 1% rule +1.6/10.0
- DSCR +0.8/10.0
- Appreciation +0.0/10.0
$349,900
🖨 Deal sheet (PDF) 📄 Offer letter ✓ Due diligence
Listing remarks MLS
Affordable 2 bedroom ranch set on private lightly wooded lot. Home features include fireplaced living room with built ins, hardwood floors, updated full bath, formal dining room area, partially finished lower level family room with fireplace, pull down stairs to attic storage, freshly painted kitchen with new flooring.
Key facts
- Finished family room
- Large 1.12 acre lot
- 1.12 acre lot
Tags
Property features AI
Exterior
- Utilities: Private well water; Septic sewage system; Domestic hot water
- Home design: Single-family home
- Construction: Frame construction; Concrete foundation; Built with typical frame and wood siding
- Exterior features: Lightly wooded, level, professionally landscaped lot; Wood siding; Asphalt shingle roof
Interior
- Kitchen: Oven/Range; Microwave; Refrigerator; Dishwasher
- Bedrooms: Three bedrooms
- Bathrooms: One full bathroom
- Heating & cooling: Hot air heat (oil-fired); Fuel tank located in basement; Thermopane windows (energy feature)
- Interior features: Six total rooms; Two fireplaces; Full basement with storage and partially finished space; Attic with pull-down stairs; Ceiling fans
- Laundry & utility: Washer and dryer included; Laundry room on lower level
Neighborhood map
What this means for you Summary
Snapshot
- This is a 2-bed/1.0-bath single-family listed at $350k.
Deal economics
- At list price, monthly cash flow is $-591 ($-7k/yr) — negative.
- To cash-flow at today's rent, offer at most $245k (29.8% below list).
- To meet the 1% rule (rent ≥ 1% of price), the offer needs to be $232k (33.7% below list).
- Recommended offer: $232k (33.7% below list) — sets the bar for 1% rule.
- Cap rate 4.3% vs local median 2.7% in Broad Brook — top-decile yield for the area; either an underpriced asset or a hidden risk that comps aren't pricing in. Stress-test before assuming the spread holds.
Location & tenants
- Location reads 73/100 on livability (#71 in CT) — a middle-class / working-renter tenant base. Strengths: crime A+, housing A+, employment A; Watch: amenities F, commute F.
- South Windsor School District (suburban): math 60% / reading 69% proficiency, ranked #27 of 153 in CT (top 18%) — acceptable for families but not a draw, mixed tenant base, ~2y average lease; only 9% free/reduced lunch — higher-income household profile.
- Zoned schools: Eli Terry School (math 52% / reading 56%, grade C, #207 of 553 statewide, top 38%, 505 students, 18% FRL); South Windsor High School (math 55% / reading 72%, grade B-, #38 of 194 statewide, top 19%, 1,329 students, 17% FRL).
- Market conditions: Rents rising (+2.8%/yr); 118 active listings in the ZIP; high-income renter base; 1,867 units permitted in Capitol Planning Region in 2024 (1,399 in 5+ unit buildings).
Forward outlook
- Local home prices are declining (-3.0%/yr); year-one equity from $2k of loan paydown is wiped out by about $10k of value loss. Plan a longer hold.
Negotiation context
- Only 8 days on market — expect competitive offers; lowballing is unlikely to land.
- 6 sale attempts since 24y ago with the ask held roughly flat each time — persistent listings suggest the price (not the market) is what's stuck; bring a comps-based counter.
Risks & watch-outs
- Watch-outs: built in 1955 — expect roof / HVAC / electrical / plumbing capex.
Questions for the listing agent
- What do current leases actually rent for vs. the listed asking? Can we see a recent rent roll and the last 12 months of T-12 income?
- Built in 1955 — when were the roof, HVAC, electrical panel, plumbing, and water heater last replaced?
- Is there a deadline driving the sale (1031 exchange, divorce, estate, relocation)? That informs how much negotiation room exists.
- Schools are D-rated, which usually means shorter tenancies and higher turnover. Who's the typical renter profile here, and what's been the actual vacancy rate?
- The area grade is low — what's the realistic commute time and amenity access for the typical tenant pool here? Any planned neighborhood developments (good or bad) we should know about?
- What's the average days-on-market for RENTAL listings here right now (not sales)? A rising rental-DOM trend means longer vacancies and softer asking-rent achievability than the comps imply.
- What's the recent tenant-quality profile in this submarket — average credit score on applications, eviction rate, late-payment / NSF rate, and stable-employment percentage? A property-management company in the area should have these aggregated.
- How much new for-sale + rental construction is in the pipeline within 1–3 miles? Heavy new supply typically softens prices + rents 12–24 months out; constrained supply supports both.
Investment metrics
- 1% rule
- 0.66% ✗
- Cap rate
- 4.27%
- Cash-on-cash
- -7.24%
- DSCR
- 0.68
- GRM
- 12.6
CMA / ARV
- ARV (median comp)
- $391,047
- List price
- $349,900
- Delta
- -10.52%
- Verdict
- UNDERPRICED
- Comps
- 20 within 1.0 mi
Show comp detail 6 sales within ~0.75 mi
| Address | Dist | Beds/Ba | Sqft | Sold | Price | $/sf | Match |
|---|---|---|---|---|---|---|---|
| 37 Farnham Rd | 0.41mi | 3/1.0 (+1) | 1,245 (+4%) | 1mo | $402,500 | $323 | 68 |
| 74 Alison Dr | 0.53mi | 3/1.0 (+1) | 1,114 (-7%) | 6mo | $370,000 | $332 | 54 |
| 556 Rye St | 0.54mi | 2/2.0 | 1,186 (-1%) | 19mo | $330,000 | $278 | 54 |
| 40 Meryl Rd | 0.51mi | 3/1.5 (+1) | 1,296 (+8%) | 14mo | $450,000 | $347 | 43 |
| 31 Wendy Dr | 0.73mi | 3/1.5 (+1) | 1,340 (+12%) | 5mo | $410,000 | $306 | 34 |
| 165 Scantic Meadow Rd | 0.73mi | 3/1.5 (+1) | 1,055 (-12%) | 11mo | $330,000 | $313 | 30 |
Match score weights: distance 35% · size 25% · config 20% · recency 20%. Top-matched comps best support the ARV.
Projected returns pro-forma
-3.0% appreciation · 2.75% rent growth · sell at horizon
- IRR
- -29.2%
- Equity multiple
- 0.03×
- Total profit
- $-94,899
- Equity at exit
- $52,171
- IRR
- -30.4%
- Equity multiple
- -0.36×
- Total profit
- $-133,345
- Equity at exit
- $30,253
Cash invested: $97,972 (down + closing). Projections, not guarantees.
Landlord ↔ Tenant lean methodology
- Overall (STATE)
- 27 Tenant-Leaning
- State Connecticut
- 27 Tenant-Leaning · D+7
- County
- — inherits STATE
- City
- — inherits STATE
ZIP-level market 06074
- Rents YoY
- 2.8%
- Active inventory
- 118
- Price-to-rent
- 12.6×
Monthly cashflow live
- Estimated rent
- $2,319 medium interval (Pro) →
- Mortgage (P&I)
- −$1,835
- Tax from tax record
- −$442 /mo · $5,306/yr
- Insurance
- −$146
- HOA
- −$0
- Vacancy / Maint / Mgmt
- −$487
- Net cashflow
- $-591
Break-even live
Sensitivity live
| Price | -10% $-393 | -5% $-492 | +0% $-591 | +5% $-690 | +10% $-789 |
|---|---|---|---|---|---|
| Rent | -10% $-774 | -5% $-683 | +0% $-591 | +5% $-500 | +10% $-408 |
| Rate | -1.0pp $-415 | -0.5pp $-502 | base $-591 | +0.5pp $-682 | +1.0pp $-774 |
UW: 25.0% down · 7.5% · 30yr · 1.5% tax · 5.0% vac · 8.0% maint · 8.0% mgmt
Financing live
Cash to close
- Down payment
- $87,475
- Closing costs
- $10,497
- Reserves months
- —
- Total cash needed
- —
Loan-product check · same deal, 3 products live
Conventional
25% down · 7.5% · 30yr
- Down + closing
- —
- Monthly P&I
- —
- Monthly cashflow
- —
- DSCR
- —
- Eligible?
- —
Personal DTI + credit; lowest rate.
DSCR
20% down · 8.5% · 30yr
- Down + closing
- —
- Monthly P&I
- —
- Monthly cashflow
- —
- DSCR
- —
- Eligible?
- —
No personal income docs; deal must DSCR.
Hard money
10% down · 12.0% · 12mo
- Down + closing
- —
- Monthly P&I
- —
- Monthly cashflow
- —
- DSCR
- —
- Eligible?
- —
Short-term bridge; refi at stabilization.
Listing history 14 events
-
2026-05-06status Under Contract 919-char remark
-
2026-04-28$349,900 Active 919-char remark
-
2025-11-17soldstatus $275,000
-
2017-06-26soldstatus $158,500
-
2017-03-23soldstatus $158,500 320-char remark
Show marketing remark (320 chars)
Affordable 2 bedroom ranch set on private lightly wooded lot. Home features include fireplaced living room with built ins, hardwood floors, updated full bath, formal dining room area, partially finished lower level family room with fireplace, pull down stairs to attic storage, freshly painted kitchen with new flooring.
-
2017-02-26$162,500 320-char remark
Show marketing remark (320 chars)
Affordable 2 bedroom ranch set on private lightly wooded lot. Home features include fireplaced living room with built ins, hardwood floors, updated full bath, formal dining room area, partially finished lower level family room with fireplace, pull down stairs to attic storage, freshly painted kitchen with new flooring.
-
2016-10-18historical
-
2016-07-18$169,900
-
2016-06-30historical
-
2016-02-06$169,900
-
2016-01-27historical
-
2015-08-05$169,900
-
2002-09-27soldstatus $148,500
-
2002-07-26$145,000
ⓘ Source: listings_history table (triggers on properties + properties_extension) + one-shot
backfill from property_details.listing_events for pre-trigger history.
Tax reassessment forecast CT · Partial reset (capped growth)
- Current annual tax
- $5,306 · $442/mo
- Projected year-2 tax
- $6,397 · $533/mo
- Expected delta
- +$1,091/yr (+$91/mo · 20.6%)
ⓘ Screening estimate from a state-policy table — verify with the county assessor before closing.
Nearby sold comps map
Loading sold comps map…
Walkable amenities ~0.75 mi
Loading nearby amenities…
Taxation est. · year 1
- Rental income
- $27,822
- − Mortgage interest
- −$19,600
- − Property taxes
- −$5,306
- − Insurance
- −$1,750
- − Repairs & maintenance
- −$2,226
- − Management
- −$2,226
- − Depreciation
- −$10,179
- Taxable loss
- −$13,463
- Est. tax savings @ 24.0%
- +$3,231
- After-tax cash flow
- $-3,864/yr
For passive investors: Depreciation is non-cash, so a rental often shows a tax loss while cash-flowing — sheltering income. Rental losses are passive: they offset passive income freely, and up to $25,000/yr can offset ordinary (W-2) income if you actively participate and your MAGI is under $100k (phasing out to $0 by $150k); unused losses carry forward. On sale, claimed depreciation is recaptured at up to 25%, and gains may owe capital-gains tax (a 1031 exchange can defer both). Figures are a year-1 estimate at your 24.0% rate — not tax advice; consult a CPA.
Schools (NCES district)
- District
- South Windsor School District
- NCES district ID
- 0904170
- Math proficiency
- 60% ▼ -9.00%
- Reading proficiency
- 69% ▼ -6.00%
- Median HH income
- $93,730
- Composite
- 58.96/100
- National rank
- #965
- State rank
- #27 of 153 in CT
Livability — Broad Brook
- Score
- 73/100
- State rank
- #71
- US rank
- #5176
Category grades
Schools grade is shown separately in the Schools card above.
Census & demographics
- County
- Hartford County · 754,208 people
- City population
- 6,833
- Metro
- Hartford-East Hartford-Middletown, CT
- Population (ZIP)
- 26,907
- Household income
- $144,961
- Rent vs Own
- Severe rent burden
- 288.0
Population outlook (Capitol County) Hauer SSP2
- By 2040
- 1,063,519
Race, ethnicity, and origin ACS 2023
- Neighborhood character
- Majority White (64%)
- Race & ethnicity
- White 64% Asian 21% Two or more races 6% Hispanic / Latino 6% Black 4%
- Hispanic origin (detail)
- Puerto Rican 3%
- Common ancestry
- Romanian 7% Lithuanian 4% Russian 2%
- Foreign-born
- 21% · Canada, China
- Languages at home
- 74% English-only · Other Indo-European 13% Other Asian/Pacific 6% Spanish 3%
Political lean MEDSL · Capitol
- 2024 margin
- Strong D (+21.9) · D 60.1% · R 38.2% · Other 1.7%
- All cycles
- 2024: D+21.9
Not yet ingested
- Civics
- —
Market trends
- HPI YoY
- ▼ -180.94%
- Current HPI
- 193.4197
- Rent YoY
- ▲ 2.75%
- Metro
- Hartford-East Hartford-Middletown, CT
- State GDP YoY
- ▲ 1.06%
- F500 in state
- 38
Industry mix (Fortune 500 HQ in CT)
| Industry | F500 HQs | Revenue |
|---|---|---|
| Industrial Machinery | 4 | $38B |
|
||
| Insurance | 3 | $71B |
|
||
| Financial Services | 2 | $25B |
|
||
| Transportation / Logistics | 2 | $18B |
|
||
| Healthcare | 1 | $247B |
|
||
| Telecommunications | 1 | $55B |
|
||
Price history
+162.1% since first listed15 events — show timeline
- 2026-06-10 Sold (MLS) $380,000 Smart MLS
- 2026-05-06 Pending — Smart MLS
- 2026-04-28 Listed $349,900 Smart MLS
- 2025-11-17 Sold (Public Records) $275,000 Public Records
- 2017-06-26 Sold (Public Records) $158,500 Public Records
- 2017-03-23 Sold (MLS) $158,500 Smart MLS
- 2017-02-26 Listed $162,500 Smart MLS
- 2016-10-18 Listing Removed — Smart MLS
- 2016-07-18 Listed $169,900 Smart MLS
- 2016-06-30 Listing Removed — Smart MLS
- 2016-02-06 Listed $169,900 Smart MLS
- 2016-01-27 Listing Removed — Smart MLS
- 2015-08-05 Listed $169,900 Smart MLS
- 2002-09-27 Sold (MLS) $148,500 Smart MLS
- 2002-07-26 Listed $145,000 Smart MLS
Property tax history
+1.1%/yrLatest (2025): $5,306 · +3.3% YoY. Source: county tax records.
Cash-flow waterfall
monthlySold comps — $/sqft
last 12 mo · ≤1 miLoading sold comps…