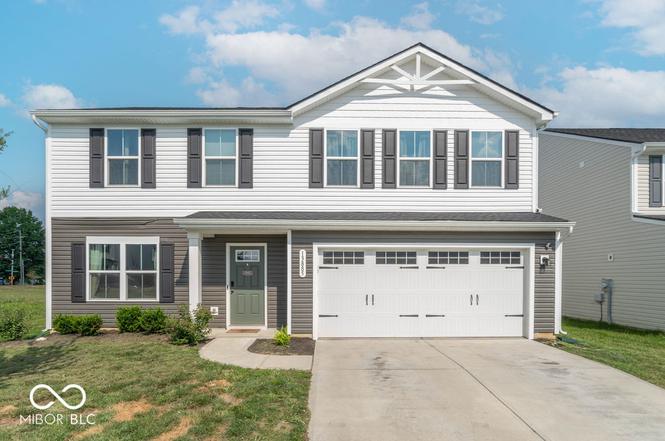
13885 N Rising Sun Cir E
Indianapolis city (balance), IN 46113
$280,000D+
4 bd · 2.5 ba ·
1,900 sqft ·
Built 2023
· SingleFamily
· Pending
· 131 DOM
Cashflow @ list (25.0% down · 7.5%)
Estimated rent
$2,463/mo
Mortgage (P&I)
−$1,468
Tax + insurance
−$223
HOA
−$30
Vac / Maint / Mgmt
−$517
Net cashflow
$224/mo
Annual
$2,687/yr
Cap rate
7.25%
Cash-on-cash
3.43%
DSCR
1.15
1% rule
0.88%
Cash to close
$78,400
Investor read
- This is a 4-bed/2.5-bath single-family listed at $280k.
- At list price, monthly cash flow is $224 ($3k/yr) — positive.
- The deal already cash-flows at list — no discount required.
- To meet the 1% rule (rent ≥ 1% of price), the offer needs to be $246k (12.0% below list).
- It's been on market 131 days — a 12% lower offer ($246k) is reasonable based on typical stale-listing flexibility.
- Recommended offer: $246k (12.0% below list) — sets the bar for 1% rule.
- Local home prices are declining (-3.0%/yr); year-one equity from $2k of loan paydown is wiped out by about $8k of value loss. Plan a longer hold.
- Location reads: area grade D — affects rentability + tenant quality, not the cash-flow math above.
- Mooresville Consolidated School Corporation (suburban): math 41% / reading 43% proficiency, ranked #111 of 301 in IN (top 37%) — families likely to look elsewhere, expect single-tenant / working-renter base with shorter leases.
- Zoned schools: North Madison Elementary School (math 48% / reading 33%, grade F, #491 of 994 statewide, top 50%, 632 students, 46% FRL); Mooresville High School (math 43% / reading 74%, grade C, #60 of 369 statewide, top 16%, 1,404 students, 39% FRL).
- Market conditions: Rents rising (+2.9%/yr); 63 active listings in the ZIP; 5 comparable units currently listed for rent nearby; rentals at typical pace (median 17d on market — plan ~3-4 weeks tenant-placement turnaround); solid renter incomes; 330 units permitted in Morgan County in 2024 (0 in 5+ unit buildings).
- Morgan County population projected to shrink 6% by 2050 — rents likely to lag national; underwrite the cash flow, not the appreciation.
- 3 sale attempts; this cycle's ask has dropped $20k (7%) from the opening price — seller is motivated, your offer sets the floor, not the list.
- Cap rate 7.3% vs local median 4.4% in Indianapolis city (balance) — top-decile yield for the area; either an underpriced asset or a hidden risk that comps aren't pricing in. Stress-test before assuming the spread holds.
- This rent runs 35% of the median local income ($84k/yr) — at the standard rent-burdened threshold; future hikes will face affordability resistance.
Questions for listing agent
- It's been on market 131 days. Have you received any prior offers? Is the seller open to a 12% concession, seller financing, or rate buy-down credit?
- What does the HOA fee cover, when was the last increase, and are there any pending special assessments or reserve-fund shortfalls?
- Why hasn't it sold? Are there any deal-killer items the seller is aware of (foundation, flood, title, zoning, code violations)?
- Is there a deadline driving the sale (1031 exchange, divorce, estate, relocation)? That informs how much negotiation room exists.
- The area grade is low — what's the realistic commute time and amenity access for the typical tenant pool here? Any planned neighborhood developments (good or bad) we should know about?
- What's the average days-on-market for RENTAL listings here right now (not sales)? A rising rental-DOM trend means longer vacancies and softer asking-rent achievability than the comps imply.
- What's the recent tenant-quality profile in this submarket — average credit score on applications, eviction rate, late-payment / NSF rate, and stable-employment percentage? A property-management company in the area should have these aggregated.
- How much new for-sale + rental construction is in the pipeline within 1–3 miles? Heavy new supply typically softens prices + rents 12–24 months out; constrained supply supports both.
CashFlowRE · CFR-EHHTPHA7CEVJ0X
· Data 3 weeks ago
cashflowre.app · 2026-05-29