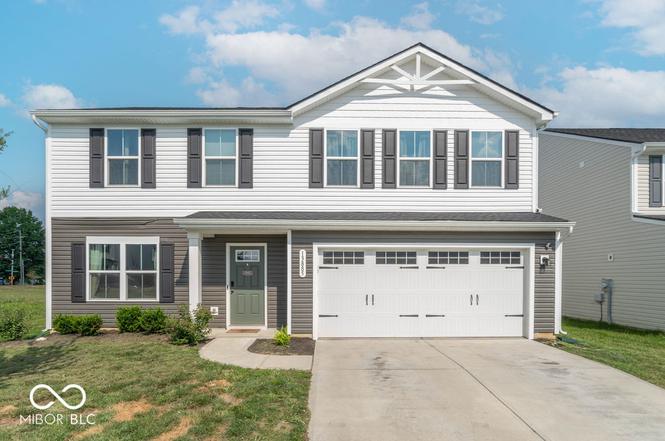
13885 N Rising Sun Cir E · Indianapolis city (balance), IN
Flood risk No data
- FEMA flood zone
- —
- Chance of flooding over 30 yrs
- —
- Est. flood insurance / yr
- —
Fire risk No data
- Est. fire insurance / yr
- —
Heat risk No data
- Hot days now (above threshold)
- —
- Hot days in 30 yrs
- —
Wind risk No data
- Chance of severe wind over 30 yrs
- —
Air-quality risk No data
- Unhealthy air days now
- —
- Unhealthy air days in 30 yrs
- —
Risk factors via First Street. Map © Google.
Why this score? — see what drove the D+ grade
The composite is a weighted blend of 9 inputs, each scored 0–100. Each bar is that input's sub-score; the figure is the points it added to the 100-point composite (weight × sub-score).
- Cash flow +17.7/30.0
- ARV discount +11.1/15.0
- DSCR +5.5/10.0
- 1% rule +3.8/10.0
- Schools +3.7/10.0
- Rent growth +3.2/5.0
- Livability +2.5/5.0
- Condition / age +2.5/5.0
- Appreciation +0.0/10.0
$280,000
🖨 Deal sheet 📄 Offer letter ✓ Due diligence
Listing remarks
Welcome to this beautifully maintained 5-bedroom, 2.5-bath two-story home, offering both space and functionality in a prime location close to shopping, restaurants, and I-67. Step into a bright and open great room that flows seamlessly into the kitchen, featuring a center island and all kitchen appliances included-even the washer and dryer. A dining area adjacent to the kitchen complements the open-concept feel, making the main level perfect for both entertaining and everyday living. The main-level bedroom just off the kitchen is ideal for guests, a home office, or a playroom. Upstairs, you'll find the spacious primary suite, complete with a walk-in closet, double sinks, and a sleek glass s
Key facts
- Main-level bedroom
- Walk-in closet
- Glass shower
Tags
Neighborhood map
What this means for you Summary
Snapshot
- This is a 4-bed/2.5-bath single-family listed at $280k.
Deal economics
- At list price, monthly cash flow is $224 ($3k/yr) — positive.
- The deal already cash-flows at list — no discount required.
- To meet the 1% rule (rent ≥ 1% of price), the offer needs to be $246k (12.0% below list).
- Recommended offer: $246k (12.0% below list) — sets the bar for 1% rule.
- Cap rate 7.3% vs local median 4.4% in Indianapolis city (balance) — top-decile yield for the area; either an underpriced asset or a hidden risk that comps aren't pricing in. Stress-test before assuming the spread holds.
Location & tenants
- Location reads: area grade D — affects rentability + tenant quality, not the cash-flow math above.
- Mooresville Consolidated School Corporation (suburban): math 41% / reading 43% proficiency, ranked #111 of 301 in IN (top 37%) — families likely to look elsewhere, expect single-tenant / working-renter base with shorter leases.
- Zoned schools: North Madison Elementary School (math 48% / reading 33%, grade F, #491 of 994 statewide, top 50%, 632 students, 46% FRL); Mooresville High School (math 43% / reading 74%, grade C, #60 of 369 statewide, top 16%, 1,404 students, 39% FRL).
- Market conditions: Rents rising (+2.9%/yr); 63 active listings in the ZIP; 5 comparable units currently listed for rent nearby; rentals at typical pace (median 16d on market — plan ~3-4 weeks tenant-placement turnaround); solid renter incomes; 330 units permitted in Morgan County in 2024 (0 in 5+ unit buildings).
- This rent runs 35% of the median local income ($84k/yr) — at the standard rent-burdened threshold; future hikes will face affordability resistance.
Forward outlook
- Local home prices are declining (-3.0%/yr); year-one equity from $2k of loan paydown is wiped out by about $8k of value loss. Plan a longer hold.
- Morgan County population projected to shrink 6% by 2050 — rents likely to lag national; underwrite the cash flow, not the appreciation.
Negotiation context
- It's been on market 131 days — a 12% lower offer ($246k) is reasonable based on typical stale-listing flexibility.
- 3 sale attempts; this cycle's ask has dropped $20k (7%) from the opening price — seller is motivated, your offer sets the floor, not the list.
Questions for the listing agent
- It's been on market 131 days. Have you received any prior offers? Is the seller open to a 12% concession, seller financing, or rate buy-down credit?
- What does the HOA fee cover, when was the last increase, and are there any pending special assessments or reserve-fund shortfalls?
- Why hasn't it sold? Are there any deal-killer items the seller is aware of (foundation, flood, title, zoning, code violations)?
- Is there a deadline driving the sale (1031 exchange, divorce, estate, relocation)? That informs how much negotiation room exists.
- The area grade is low — what's the realistic commute time and amenity access for the typical tenant pool here? Any planned neighborhood developments (good or bad) we should know about?
- What's the average days-on-market for RENTAL listings here right now (not sales)? A rising rental-DOM trend means longer vacancies and softer asking-rent achievability than the comps imply.
- What's the recent tenant-quality profile in this submarket — average credit score on applications, eviction rate, late-payment / NSF rate, and stable-employment percentage? A property-management company in the area should have these aggregated.
- How much new for-sale + rental construction is in the pipeline within 1–3 miles? Heavy new supply typically softens prices + rents 12–24 months out; constrained supply supports both.
Investment metrics
- 1% rule
- 0.88% ✗
- Cap rate
- 7.25%
- Cash-on-cash
- 3.43%
- DSCR
- 1.15
- GRM
- 9.5
CMA / ARV
- ARV (on-the-fly)
- $304,000
- Comps found
- 12
Show comp detail 12 sales within ~0.75 mi
| Address | Dist | Beds/Ba | Sqft | Sold | Price | $/sf | Match |
|---|---|---|---|---|---|---|---|
| 13885 N Rising Sun Cir E | 0.00mi | 5/2.5 (+1) | 1,918 (+1%) | 0mo | $273,000 | $142 | 93 |
| 13874 N Hawkers Hill Dr | 0.20mi | 4/2.5 | 1,900 (0%) | 3mo | $305,000 | $161 | 89 |
| 7208 E Rising Sun Cir N | 0.15mi | 4/2.5 | 1,903 (+0%) | 10mo | $304,945 | $160 | 84 |
| 7119 E Rising Sun Cir N | 0.25mi | 4/2.5 | 1,903 (+0%) | 9mo | $289,990 | $152 | 81 |
| 13841 N Cardonia Dr | 0.29mi | 4/2.5 | 1,920 (+1%) | 5mo | $105,000 | $55 | 81 |
| 7111 E Rising Sun Cir N | 0.25mi | 4/2.5 | 1,924 (+1%) | 8mo | $317,000 | $165 | 79 |
| 13844 N Cardonia Dr | 0.31mi | 4/2.5 | 1,920 (+1%) | 10mo | $263,000 | $137 | 76 |
| 13813 N Hawkers Hill Dr | 0.20mi | 4/2.5 | 1,740 (-8%) | 12mo | $290,000 | $167 | 67 |
| 13849 N Fairwood Dr | 0.12mi | 3/2.0 (-1) | 1,658 (-13%) | 0mo | $265,000 | $160 | 66 |
| 13835 N Cardonia Dr | 0.29mi | 4/2.5 | 1,680 (-12%) | 3mo | $31,000 | $18 | 65 |
| 7195 E Rising Sun Cir S | 0.16mi | 4/2.5 | 1,680 (-12%) | 12mo | $295,000 | $176 | 63 |
| 13862 N Americus Way | 0.59mi | 3/2.0 (-1) | 1,694 (-11%) | 10mo | $292,425 | $173 | 39 |
Match score weights: distance 35% · size 25% · config 20% · recency 20%. Top-matched comps best support the ARV.
Projected returns pro-forma
-3.0% appreciation · 2.88% rent growth · sell at horizon
- IRR
- -11.1%
- Equity multiple
- 0.60×
- Total profit
- $-31,499
- Equity at exit
- $41,749
- IRR
- -2.0%
- Equity multiple
- 0.86×
- Total profit
- $-10,660
- Equity at exit
- $24,209
Cash invested: $78,400 (down + closing). Projections, not guarantees.
Landlord ↔ Tenant lean methodology
- Overall (STATE)
- 90 Strongly Landlord-Friendly
- State Indiana
- 90 Strongly Landlord-Friendly · R+11
- County
- — inherits STATE
- City
- — inherits STATE
ZIP-level market 46113
- Home prices YoY
- -13.0%
- Rents YoY
- 2.9%
- Active inventory
- 63
- Price-to-rent
- 9.5×
Monthly cashflow live
- Estimated rent
- $2,463 high interval (Pro) →
- Mortgage (P&I)
- −$1,468
- Tax from tax record
- −$107 /mo · $1,279/yr
- Insurance
- −$117
- HOA
- −$30
- Vacancy / Maint / Mgmt
- −$517
- Net cashflow
- $224
Break-even live
UW: 25.0% down · 7.5% · 30yr · 1.5% tax · 5.0% vac · 8.0% maint · 8.0% mgmt
Financing live
Cash to close
- Down payment
- $70,000
- Closing costs
- $8,400
- Reserves months
- —
- Total cash needed
- —
Loan-product check · same deal, 3 products live
Conventional
25% down · 7.5% · 30yr
- Down + closing
- —
- Monthly P&I
- —
- Monthly cashflow
- —
- DSCR
- —
- Eligible?
- —
Personal DTI + credit; lowest rate.
DSCR
20% down · 8.5% · 30yr
- Down + closing
- —
- Monthly P&I
- —
- Monthly cashflow
- —
- DSCR
- —
- Eligible?
- —
No personal income docs; deal must DSCR.
Hard money
10% down · 12.0% · 12mo
- Down + closing
- —
- Monthly P&I
- —
- Monthly cashflow
- —
- DSCR
- —
- Eligible?
- —
Short-term bridge; refi at stabilization.
Rent comps 5 comps
| Address | Beds | Baths | Sqft | Rent | $/sqft | DOM | Units | Dist |
|---|---|---|---|---|---|---|---|---|
| 13823 N Cardonia Dr Camby, IN | 5.0 | 2.5 | 2200 | $2,675 | $1.22 | 17d | 1 | 0.29mi |
| 13857 N Mardenis Dr W Camby, IN | 3.0 | 2.0 | 1440 | $1,905 | $1.32 | 23d | 1 | 0.39mi |
| 13320 N White Cloud Ct Camby, IN | 3.0 | 2.0 | 1911 | $2,000 | $1.05 | 16d | 1 | 1.13mi |
| 13134 N Etna Green Dr Camby, IN | 3.0 | 2.5 | 1613 | $1,855 | $1.15 | 16d | 1 | 1.39mi |
| 13147 N Becks Grove Ct Camby, IN | 3.0 | 2.0 | 1440 | $1,885 | $1.31 | 4d | 1 | 1.41mi |
HOA detail
- Monthly dues
- $30 · $360/yr
Listing history 7 events
-
2026-02-12status Pending
-
2026-01-20status Active
-
2026-01-07status Pending
-
2025-11-13price $280,000
-
2025-09-24status Active
-
2025-09-12status Pending
-
2025-08-19$300,000 Active
ⓘ Source: listings_history table (triggers on properties + properties_extension) + one-shot
backfill from property_details.listing_events for pre-trigger history.
Tax reassessment forecast IN · Partial reset (capped growth)
- Current annual tax
- $1,279 · $107/mo
- Projected year-2 tax
- $1,829 · $152/mo
- Expected delta
- +$551/yr (+$46/mo · 43.0%)
ⓘ Screening estimate from a state-policy table — verify with the county assessor before closing.
Nearby sold comps map
Loading sold comps map…
Walkable amenities ~0.75 mi
Loading nearby amenities…
Taxation est. · year 1
- Rental income
- $29,553
- − Mortgage interest
- −$15,684
- − Property taxes
- −$1,279
- − Insurance
- −$1,400
- − Repairs & maintenance
- −$2,364
- − Management
- −$2,364
- − HOA
- −$360
- − Depreciation
- −$8,145
- Taxable loss
- −$2,045
- Est. tax savings @ 24.0%
- +$491
- After-tax cash flow
- $3,178/yr
For passive investors: Depreciation is non-cash, so a rental often shows a tax loss while cash-flowing — sheltering income. Rental losses are passive: they offset passive income freely, and up to $25,000/yr can offset ordinary (W-2) income if you actively participate and your MAGI is under $100k (phasing out to $0 by $150k); unused losses carry forward. On sale, claimed depreciation is recaptured at up to 25%, and gains may owe capital-gains tax (a 1031 exchange can defer both). Figures are a year-1 estimate at your 24.0% rate — not tax advice; consult a CPA.
Schools (NCES district)
- District
- Mooresville Consolidated School Corporation
- NCES district ID
- 1807140
- Math proficiency
- 41% ▼ -11.00%
- Reading proficiency
- 43% ▼ -9.00%
- Median HH income
- $59,316
- Composite
- 37.04/100
- National rank
- #4511
- State rank
- #111 of 301 in IN
Livability — Indianapolis city (balance)
No livability data for this city. (Only ~50 U.S. cities are tracked.)
Census & demographics
- County
- Marion County · 998,460 people
- City population
- 881,119
- Metro
- Indianapolis-Carmel-Anderson, IN
- Population (ZIP)
- 17,192
- Household income
- $84,463
- Rent vs Own
- Severe rent burden
- 201.0
Population outlook (Morgan County) Hauer SSP2
- Today (2025)
- 71,081 people
- By 2030
- 71,178 · +0.1%
- By 2040
- 69,907 · -1.7%
- By 2050
- 66,455 · -6.5%
- By 2075
- 57,291 · -19.4%
- By 2100
- 43,782 · -38.4%
Race, ethnicity, and origin ACS 2023
- Neighborhood character
- Predominantly White (73%)
- Race & ethnicity
- White 73% Black 16% Two or more races 7% Hispanic / Latino 6%
- Hispanic origin (detail)
- Mexican 3% Puerto Rican 2%
- Common ancestry
- Hispanic 5% Lithuanian 3% Slovak 2%
- Foreign-born
- 10% · Canada
- Languages at home
- 88% English-only · Spanish 5% French/Haitian/Cajun 5%
Political lean MEDSL · Morgan
- 2024 margin
- Solid R (+54.3) · D 22.0% · R 76.3% · Other 1.7%
- 2008→2024 swing
- -27.3pp toward R · 2008: -27.1pp · 2024: -54.3pp
- All cycles
- 2024: R+54.3 2020: R+54.6 2016: R+56.6 2012: R+41.1 2008: R+27.1
Not yet ingested
- Civics
- —
Market trends
- HPI YoY
- ▼ -33.73%
- Current HPI
- 225.185
- Rent YoY
- ▲ 2.88%
- Metro
- Indianapolis-Carmel-Anderson, IN
- State GDP YoY
- ▲ 2.90%
- F500 in state
- 18
Industry mix (Fortune 500 HQ in IN)
| Industry | F500 HQs | Revenue |
|---|---|---|
| Industrial Machinery | 2 | $37B |
|
||
| Healthcare | 1 | $177B |
|
||
| Pharmaceuticals | 1 | $45B |
|
||
| Metals / Steel | 1 | $18B |
|
||
| Agriculture | 1 | $17B |
|
||
| Packaging | 1 | $12B |
|
||
Price history
-6.7% since first listed7 events — show timeline
- 2026-02-12 Pending — MIBOR as Distributed by MLS Grid
- 2026-01-20 Relisted — MIBOR as Distributed by MLS Grid
- 2026-01-07 Pending — MIBOR as Distributed by MLS Grid
- 2025-11-13 Price Changed $280,000 MIBOR as Distributed by MLS Grid
- 2025-09-24 Relisted — MIBOR as Distributed by MLS Grid
- 2025-09-12 Pending — MIBOR as Distributed by MLS Grid
- 2025-08-19 Listed $300,000 MIBOR as Distributed by MLS Grid
Property tax history
+1978.7%/yrLatest (2025): $1,279 · -4.4% YoY. Source: county tax records.
Cash-flow waterfall
monthlySold comps — $/sqft
last 12 mo · ≤1 miLoading sold comps…