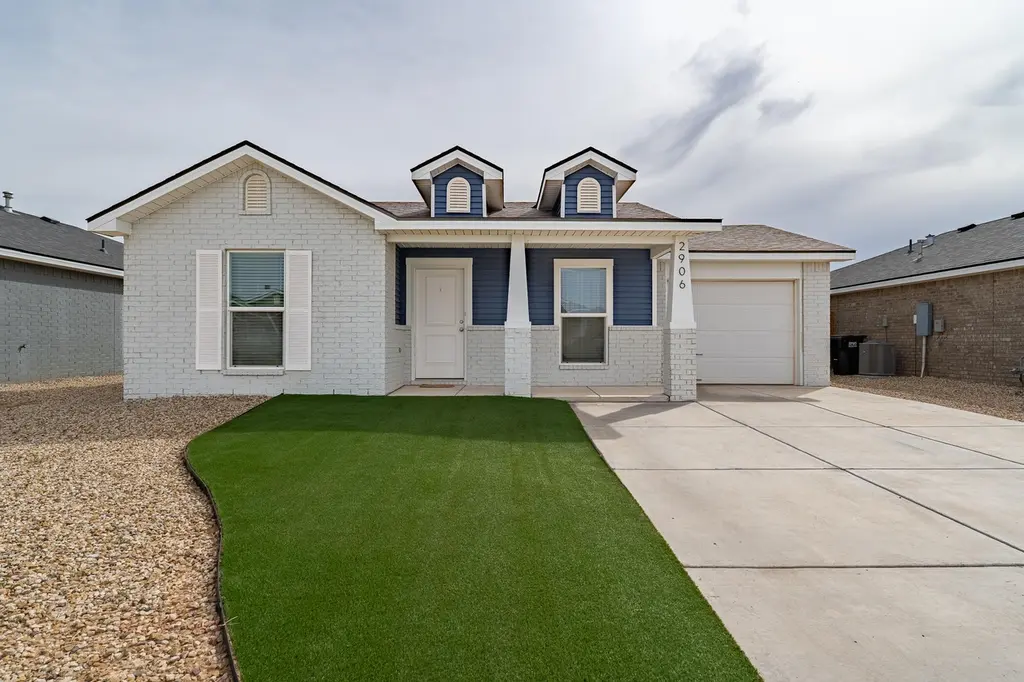
2906 Bryan Ave
Wolfforth, TX 79382
$195,000D
3 bd · 2.0 ba ·
1,232 sqft ·
Built 2023
· SingleFamily
· Active
· 97 DOM
Cashflow @ list (25.0% down · 7.5%)
Estimated rent
$1,579/mo
Mortgage (P&I)
−$1,023
Tax + insurance
−$615
HOA
−$0
Vac / Maint / Mgmt
−$332
Net cashflow
$-391/mo
Annual
$-4,687/yr
Cap rate
3.89%
Cash-on-cash
-8.58%
DSCR
0.62
1% rule
0.81%
Cash to close
$54,600
Investor read
- This is a 3-bed/2.0-bath single-family listed at $195k. Condition is rated good.
- At list price, monthly cash flow is $-391 ($-5k/yr) — negative.
- To cash-flow at today's rent, offer at most $128k (34.3% below list).
- To meet the 1% rule (rent ≥ 1% of price), the offer needs to be $158k (19.0% below list).
- It's been on market 97 days — a 9% lower offer ($177k) is reasonable based on typical stale-listing flexibility.
- Recommended offer: $128k (34.3% below list) — sets the bar for cash-flow.
- In year one you build about $21k of equity ($1k loan paydown + $20k appreciation (10.0% local appreciation)).
- Location reads 80/100 on livability (#43 in TX, #1,872 nationally) — a professional / high-income tenant draw. Strengths: cost of living A+, housing A+, health & safety A+; Watch: amenities F, commute F.
- Frenship ISD (urban): math 47% / reading 54% proficiency, ranked #162 of 826 in TX (top 20%) — acceptable for families but not a draw, mixed tenant base, ~2y average lease.
- Zoned schools: Crestview El (math 77% / reading 80%, grade A, #48 of 4,322 statewide, top 1%, 583 students, 29% FRL); Frenship Middle (math 46% / reading 50%, grade C-, #400 of 1,662 statewide, top 24%, 833 students, 47% FRL); Frenship H S (math 44% / reading 65%, grade C-, #379 of 1,632 statewide, top 26%, 3,247 students, 46% FRL) — zoned schools at 41% FRL track the district average.
- Watch-outs: property tax is 3.3% of price.
- Market conditions: 474 active listings in the ZIP; 14 comparable units currently listed for rent nearby; rentals lingering (median 46d on market — plan ~5-8 weeks vacancy on turnover, expect pricing pressure); 57% of comp listings sitting > 30 days — soft ceiling on asking rent; solid renter incomes; 2,219 units permitted in Lubbock County in 2024 (252 in 5+ unit buildings).
- Lubbock County population projected at +39% by 2050 — long-run rental-demand tailwind backs the buy-and-hold thesis.
- 2 sale attempts since 3y ago with the ask held roughly flat each time — persistent listings suggest the price (not the market) is what's stuck; bring a comps-based counter.
- By year 2, paydown + projected appreciation supports a ~$34k cash-out refi (75% LTV) — recoverable capital for the next deal without selling this one.
- Climate carrying-cost: extreme-heat days projected 7→21/yr by 2055 (HVAC capex compounding) — expect insurance premiums to compound above CPI over the hold.
Questions for listing agent
- What do current leases actually rent for vs. the listed asking? Can we see a recent rent roll and the last 12 months of T-12 income?
- It's been on market 97 days. Have you received any prior offers? Is the seller open to a 34% concession, seller financing, or rate buy-down credit?
- Property tax is high relative to price — has the assessment been appealed recently, and will the sale trigger a re-assessment?
- Why hasn't it sold? Are there any deal-killer items the seller is aware of (foundation, flood, title, zoning, code violations)?
- Is there a deadline driving the sale (1031 exchange, divorce, estate, relocation)? That informs how much negotiation room exists.
- Schools are B-rated — typically a magnet for longer-tenancy family renters. What's the average tenant stay here, and is there a school-zone premium baked into asking?
- The area grade is low — what's the realistic commute time and amenity access for the typical tenant pool here? Any planned neighborhood developments (good or bad) we should know about?
- What's the average days-on-market for RENTAL listings here right now (not sales)? A rising rental-DOM trend means longer vacancies and softer asking-rent achievability than the comps imply.
CashFlowRE · CFR-EHM2CZ5B1J6M5M
· Data 12 h ago
cashflowre.app · 2026-05-29