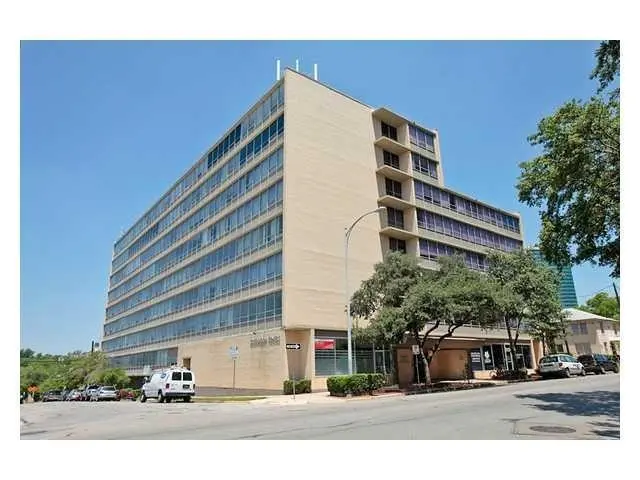
1800 Lavaca St #204
Austin, TX 78701
$184,000D
1 bd · 1.0 ba ·
565 sqft ·
Built 1966
· Condo
· Active
· 107 DOM
Cashflow @ list (25.0% down · 7.5%)
Estimated rent
$1,640/mo
Mortgage (P&I)
−$965
Tax + insurance
−$307
HOA
−$530
Vac / Maint / Mgmt
−$344
Net cashflow
$-506/mo
Annual
$-6,074/yr
Cap rate
2.99%
Cash-on-cash
-11.79%
DSCR
0.48
1% rule
0.89%
Cash to close
$51,520
Investor read
- This is a 1-bed/1.0-bath condo listed at $184k.
- At list price, monthly cash flow is $-506 ($-6k/yr) — negative.
- To cash-flow at today's rent, offer at most $111k (39.8% below list).
- To meet the 1% rule (rent ≥ 1% of price), the offer needs to be $164k (10.9% below list).
- It's been on market 107 days — a 9% lower offer ($167k) is reasonable based on typical stale-listing flexibility.
- Recommended offer: $111k (39.8% below list) — sets the bar for cash-flow.
- In year one you build about $432 of equity ($1k loan paydown + $-840 appreciation (-0.5% local appreciation)).
- Location reads 82/100 on livability (#16 in TX, #1,208 nationally) — a professional / high-income tenant draw. Strengths: amenities A+, commute A+, employment A+; Watch: cost of living D, crime F.
- Austin ISD (urban): math 33% / reading 44% proficiency, ranked #431 of 826 in TX (top 52%) — families likely to look elsewhere, expect single-tenant / working-renter base with shorter leases.
- Watch-outs: HOA is 32% of rent.
- Market conditions: Rents rising (+2.5%/yr); 297 active listings in the ZIP; 40 comparable units currently listed for rent nearby; rentals at typical pace (median 24d on market — plan ~3-4 weeks tenant-placement turnaround); high-income renter base; 17,121 units permitted in Travis County in 2024 (11,963 in 5+ unit buildings).
- Travis County population projected at +60% by 2050 — long-run rental-demand tailwind backs the buy-and-hold thesis.
- 7 sale attempts since 24y ago with the ask held roughly flat each time — persistent listings suggest the price (not the market) is what's stuck; bring a comps-based counter.
- Climate carrying-cost: severe wind risk, 80% chance of damaging wind over 30y; extreme-heat days projected 7→22/yr by 2055 (HVAC capex compounding) — expect insurance premiums to compound above CPI over the hold.
- Cap rate 3.0% vs local median 1.8% in Austin — top-decile yield for the area; either an underpriced asset or a hidden risk that comps aren't pricing in. Stress-test before assuming the spread holds.
- This rent is only 12% of the median local income ($162k/yr) — well below the 30% rent-burden line; pricing power to push rent on renewal without tenant pushback.
Questions for listing agent
- What do current leases actually rent for vs. the listed asking? Can we see a recent rent roll and the last 12 months of T-12 income?
- It's been on market 107 days. Have you received any prior offers? Is the seller open to a 40% concession, seller financing, or rate buy-down credit?
- Built in 1966 — when were the roof, HVAC, electrical panel, plumbing, and water heater last replaced?
- What does the HOA fee cover, when was the last increase, and are there any pending special assessments or reserve-fund shortfalls?
- Any open or pending special assessments — roof, HVAC, plumbing, elevator, façade? What's the per-unit balance and payoff schedule, and is the seller paying it off at close or rolling it to the buyer?
- Why hasn't it sold? Are there any deal-killer items the seller is aware of (foundation, flood, title, zoning, code violations)?
- Is there a deadline driving the sale (1031 exchange, divorce, estate, relocation)? That informs how much negotiation room exists.
- Crime grade is F in this area — have there been break-ins, vandalism, or insurance claims at this property in the last 3 years? What carrier currently insures it and at what premium?
CashFlowRE · CFR-EKN7DHCD3M1E6P
· Data 2 days ago
cashflowre.app · 2026-05-29