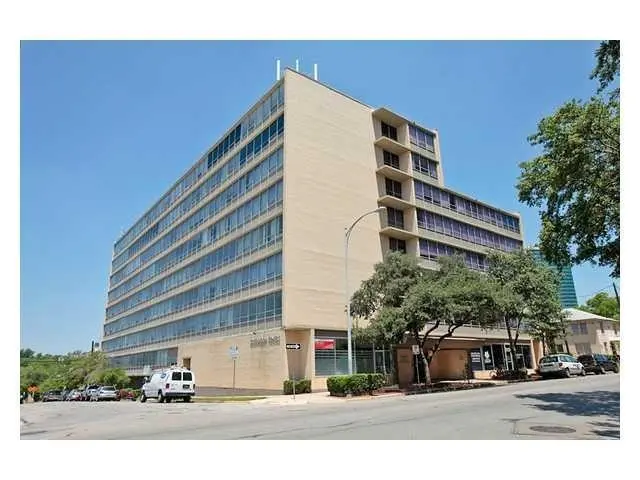
1800 Lavaca St #204 · Austin, TX
Flood risk 1/10 · Minimal
- FEMA flood zone
- X (unshaded)
- Chance of flooding over 30 yrs
- 0.0%
- Est. flood insurance / yr
- $507 – $1,088
Fire risk 1/10 · Minimal
- Est. fire insurance / yr
- $1,222 – $2,270
Heat risk 8/10 · Major
- Hot days now (above 108°F)
- 7 days/yr
- Hot days in 30 yrs
- 22 days/yr
Wind risk 8/10 · Major
- Chance of severe wind over 30 yrs
- 80.0%
Air-quality risk 2/10 · Minimal
- Unhealthy air days now
- 1 days/yr
- Unhealthy air days in 30 yrs
- 1 days/yr
Risk factors via First Street. Map © Google.
Why this score? — see what drove the D grade
The composite is a weighted blend of 9 inputs, each scored 0–100. Each bar is that input's sub-score; the figure is the points it added to the 100-point composite (weight × sub-score).
- ARV discount +15.0/15.0
- Appreciation +4.8/10.0
- Cash flow +4.1/30.0
- Livability +4.1/5.0
- 1% rule +3.9/10.0
- Schools +3.4/10.0
- Rent growth +3.1/5.0
- Condition / age +2.5/5.0
- DSCR +0.0/10.0
$184,000
🖨 Deal sheet 📄 Offer letter ✓ Due diligence
Listing remarks MLS
Magnificent Affordable Midrise bordering the University of Texas and Downtown. Open floorplan with custom ceramic tile through out with upgraded kitchen and bath with Maple Cabinets, Granite Counters, and Stainless Appliances. Secured Entry and Parking. HOA dues cover Electric, Water, Hot water, and Gas. One Block from the UT Campus and 5 blocks to the Capital. Building is on a land lease till 2065.
Key facts
- Custom ceramic tile
- Open floorplan
- Stainless appliances
Tags
Neighborhood map
What this means for you Summary
Snapshot
- This is a 1-bed/1.0-bath condo listed at $184k.
Deal economics
- At list price, monthly cash flow is $-506 ($-6k/yr) — negative.
- To cash-flow at today's rent, offer at most $111k (39.8% below list).
- To meet the 1% rule (rent ≥ 1% of price), the offer needs to be $164k (10.9% below list).
- Recommended offer: $111k (39.8% below list) — sets the bar for cash-flow.
- Cap rate 3.0% vs local median 1.8% in Austin — top-decile yield for the area; either an underpriced asset or a hidden risk that comps aren't pricing in. Stress-test before assuming the spread holds.
Location & tenants
- Location reads 82/100 on livability (#16 in TX, #1,208 nationally) — a professional / high-income tenant draw. Strengths: amenities A+, commute A+, employment A+; Watch: cost of living D, crime F.
- Austin ISD (urban): math 33% / reading 44% proficiency, ranked #431 of 826 in TX (top 52%) — families likely to look elsewhere, expect single-tenant / working-renter base with shorter leases.
- Market conditions: Rents rising (+2.5%/yr); 297 active listings in the ZIP; 40 comparable units currently listed for rent nearby; rentals at typical pace (median 24d on market — plan ~3-4 weeks tenant-placement turnaround); high-income renter base; 17,121 units permitted in Travis County in 2024 (11,963 in 5+ unit buildings).
- This rent is only 12% of the median local income ($162k/yr) — well below the 30% rent-burden line; pricing power to push rent on renewal without tenant pushback.
Forward outlook
- In year one you build about $432 of equity ($1k loan paydown + $-840 appreciation (-0.5% local appreciation)).
- Travis County population projected at +60% by 2050 — long-run rental-demand tailwind backs the buy-and-hold thesis.
Negotiation context
- It's been on market 107 days — a 9% lower offer ($167k) is reasonable based on typical stale-listing flexibility.
- 7 sale attempts since 24y ago with the ask held roughly flat each time — persistent listings suggest the price (not the market) is what's stuck; bring a comps-based counter.
Risks & watch-outs
- Watch-outs: HOA is 32% of rent.
- Climate carrying-cost: severe wind risk, 80% chance of damaging wind over 30y; extreme-heat days projected 7→22/yr by 2055 (HVAC capex compounding) — expect insurance premiums to compound above CPI over the hold.
Questions for the listing agent
- What do current leases actually rent for vs. the listed asking? Can we see a recent rent roll and the last 12 months of T-12 income?
- It's been on market 107 days. Have you received any prior offers? Is the seller open to a 40% concession, seller financing, or rate buy-down credit?
- Built in 1966 — when were the roof, HVAC, electrical panel, plumbing, and water heater last replaced?
- What does the HOA fee cover, when was the last increase, and are there any pending special assessments or reserve-fund shortfalls?
- Any open or pending special assessments — roof, HVAC, plumbing, elevator, façade? What's the per-unit balance and payoff schedule, and is the seller paying it off at close or rolling it to the buyer?
- Why hasn't it sold? Are there any deal-killer items the seller is aware of (foundation, flood, title, zoning, code violations)?
- Is there a deadline driving the sale (1031 exchange, divorce, estate, relocation)? That informs how much negotiation room exists.
- Crime grade is F in this area — have there been break-ins, vandalism, or insurance claims at this property in the last 3 years? What carrier currently insures it and at what premium?
- The area grade is low — what's the realistic commute time and amenity access for the typical tenant pool here? Any planned neighborhood developments (good or bad) we should know about?
- What's the average days-on-market for RENTAL listings here right now (not sales)? A rising rental-DOM trend means longer vacancies and softer asking-rent achievability than the comps imply.
- What's the recent tenant-quality profile in this submarket — average credit score on applications, eviction rate, late-payment / NSF rate, and stable-employment percentage? A property-management company in the area should have these aggregated.
- How much new apartment / multifamily construction is in the pipeline within 1–3 miles? Heavy new supply (>2% of stock underway) typically softens rents 12–24 months out; light construction supports rent growth.
Investment metrics
- 1% rule
- 0.89% ✗
- Cap rate
- 2.99%
- Cash-on-cash
- -11.79%
- DSCR
- 0.48
- GRM
- 9.4
CMA / ARV
- ARV (median comp)
- $228,115
- List price
- $184,000
- Delta
- -19.34%
- Verdict
- UNDERPRICED
- Comps
- 20 within 1.0 mi
Projected returns pro-forma
-0.46% appreciation · 2.54% rent growth · sell at horizon
- IRR
- -18.4%
- Equity multiple
- 0.19×
- Total profit
- $-41,936
- Equity at exit
- $49,265
- IRR
- -12.1%
- Equity multiple
- -0.16×
- Total profit
- $-59,865
- Equity at exit
- $55,992
Cash invested: $51,520 (down + closing). Projections, not guarantees.
Landlord ↔ Tenant lean methodology
- Overall (STATE)
- 87 Strongly Landlord-Friendly
- State Texas
- 87 Strongly Landlord-Friendly · R+5
- County
- — inherits STATE
- City
- — inherits STATE
ZIP-level market 78701
- Home prices YoY
- -0.2%
- Rents YoY
- 2.5%
- Active inventory
- 297
- Price-to-rent
- 9.4×
Monthly cashflow live
- Estimated rent
- $1,640 high interval (Pro) →
- Mortgage (P&I)
- −$965
- Tax est. 1.5%
- −$230 /mo · $2,760/yr
- Insurance
- −$77
- HOA
- −$530
- Vacancy / Maint / Mgmt
- −$344
- Net cashflow
- $-506
Break-even live
UW: 25.0% down · 7.5% · 30yr · 1.5% tax · 5.0% vac · 8.0% maint · 8.0% mgmt
Financing live
Cash to close
- Down payment
- $46,000
- Closing costs
- $5,520
- Reserves months
- —
- Total cash needed
- —
Loan-product check · same deal, 3 products live
Conventional
25% down · 7.5% · 30yr
- Down + closing
- —
- Monthly P&I
- —
- Monthly cashflow
- —
- DSCR
- —
- Eligible?
- —
Personal DTI + credit; lowest rate.
DSCR
20% down · 8.5% · 30yr
- Down + closing
- —
- Monthly P&I
- —
- Monthly cashflow
- —
- DSCR
- —
- Eligible?
- —
No personal income docs; deal must DSCR.
Hard money
10% down · 12.0% · 12mo
- Down + closing
- —
- Monthly P&I
- —
- Monthly cashflow
- —
- DSCR
- —
- Eligible?
- —
Short-term bridge; refi at stabilization.
Rent comps 40 comps
| Address | Beds | Baths | Sqft | Rent | $/sqft | DOM | Units | Dist |
|---|---|---|---|---|---|---|---|---|
| 505 W 18th St Unit I Austin, TX | — | 1.0 | 640 | $1,375 | $2.15 | 16d | 1 | 0.16mi |
| 502 W 17th St Unit K Austin, TX | 2.0 | 1.0 | 740 | $1,395 | $1.89 | 23d | 1 | 0.17mi |
| 2008 San Antonio St Unit 101 Austin, TX | 1.0 | 1.0 | 585 | $1,350 | $2.31 | 43d | 1 | 0.21mi |
| 1903 Nueces St Unit B Austin, TX | 1.0 | 1.0 | 750 | $1,500 | $2.00 | 43d | 1 | 0.21mi |
| 1801 Rio Grande St Austin, TX | 1.0–3.0 | 1.0–2.0 | 870 | $1,294 | $1.49 | 4d | 5 | 0.23mi |
| 1801 Rio Grande St Unit 2025 Austin, TX | 1.0 | 1.0 | 730 | $1,250 | $1.71 | 23d | 1 | 0.23mi |
| 1800 Rio Grande St #100 Austin, TX | 1.0 | 1.0 | 600 | $1,196 | $1.99 | 23d | 1 | 0.27mi |
| 2107 Rio Grande St Austin, TX | 1.0 | 1.0 | 681 | $1,599 | $2.35 | 43d | 1 | 0.33mi |
| 1812 West Ave #200 Austin, TX | 1.0 | 1.0 | 674 | $1,800 | $2.67 | 4d | 1 | 0.33mi |
| 1802 West Ave Austin, TX | 1.0–3.0 | 1.0–2.0 | 766 | $1,250 | $1.63 | 4d | 31 | 0.33mi |
| 1406 Rio Grande St Austin, TX | 1.0 | 1.0 | 606 | $1,100 | $1.82 | 23d | 1 | 0.36mi |
| 1600 West Ave Unit 19 Austin, TX | 1.0 | 1.0 | 400 | $1,020 | $2.55 | 23d | 1 | 0.37mi |
| 1600 West Ave Unit 7 Austin, TX | — | 1.0 | 400 | $1,020 | $2.55 | 23d | 1 | 0.37mi |
| 1600 West Ave Unit 25 Austin, TX | 1.0 | 1.0 | 700 | $1,520 | $2.17 | 43d | 1 | 0.37mi |
| 1600 West Ave Unit 18 Austin, TX | 1.0 | 1.0 | 700 | $1,520 | $2.17 | 21d | 1 | 0.38mi |
| 1212 Guadalupe St Austin, TX | 2.0 | 1.0–2.0 | 704 | $2,550 | $3.62 | 4d | 3 | 0.40mi |
| 1212 Guadalupe St Austin, TX | 2.0 | 1.0–2.0 | 698 | $2,322 | $3.32 | 17d | 4 | 0.40mi |
| 709 W 22nd St Austin, TX | 1.0–3.0 | 1.0–3.0 | 985 | $604 | $0.61 | 23d | 1 | 0.43mi |
| 2300 Nueces St Austin, TX | 3.0 | 1.0–3.0 | 813 | $1,403 | $1.73 | 43d | 1 | 0.45mi |
| 1905 San Gabriel St #101 Austin, TX | 1.0 | 1.0 | 369 | $1,100 | $2.98 | 20d | 1 | 0.46mi |
| 904 W 21st St Austin, TX | 1.0–3.0 | 1.0–3.0 | 659 | $850 | $1.29 | 4d | 14 | 0.46mi |
| 2306 Nueces St Austin, TX | 1.0 | 1.0 | 520 | $1,225 | $2.36 | 23d | 1 | 0.47mi |
| 908 W 21st St Unit 101 Austin, TX | 2.0 | 1.0 | 700 | $1,395 | $1.99 | 43d | 1 | 0.47mi |
| 1122 Colorado St Austin, TX | 1.0–2.0 | 1.0–2.0 | 917 | $2,200 | $2.40 | 43d | 2 | 0.49mi |
| 915 W 21st St #2 Austin, TX | — | 1.0 | 400 | $1,200 | $3.00 | 23d | 1 | 0.49mi |
| 915 W 21st St #1 Austin, TX | 1.0 | 1.0 | 400 | $1,200 | $3.00 | 23d | 1 | 0.49mi |
| 911 W 22nd St Austin, TX | 1.0–4.0 | 0.5–2.0 | 1150 | $500 | $0.43 | 4d | 10 | 0.50mi |
| Rainier Unit 1600 Austin, TX | 1.0 | 1.0 | 749 | $2,550 | $3.40 | 43d | 1 | 0.59mi |
| 806 W 24th St #200 Austin, TX | 2.0 | 1.0 | 715 | $1,800 | $2.52 | 4d | 1 | 0.60mi |
| 607 W 11th St Austin, TX | 1.0 | 1.0 | 696 | $1,150 | $1.65 | 23d | 1 | 0.60mi |
| 2207 Leon St Austin, TX | 1.0–2.0 | 1.0–2.0 | 664 | $1,200 | $1.81 | 12d | 1 | 0.60mi |
| 2201 Leon St Unit D Austin, TX | — | 1.0 | 500 | $1,650 | $3.30 | 43d | 1 | 0.60mi |
| 827 W 12th St Austin, TX | 2.0 | 1.0–2.0 | 571 | $1,847 | $3.23 | 4d | 3 | 0.61mi |
| 827 W 12th St Unit 417 Austin, TX | — | 1.0 | 353 | $1,365 | $3.87 | 23d | 1 | 0.62mi |
| 807 W 25th St Austin, TX | 2.0 | 1.0–2.0 | 806 | $1,800 | $2.23 | 21d | 2 | 0.64mi |
| 1106 W 22nd St Austin, TX | 1.0 | 1.0 | 500 | $1,200 | $2.40 | 20d | 1 | 0.65mi |
| 1106 W 22nd St #9 Austin, TX | 1.0 | 1.0 | 504 | $1,200 | $2.38 | 23d | 1 | 0.65mi |
| 501 W 26th St Austin, TX | 1.0–3.0 | 1.0–3.0 | 907 | $1,250 | $1.38 | 17d | 3 | 0.65mi |
| 1010 W 23rd St Austin, TX | 1.0 | 1.0 | 525 | $1,238 | $2.36 | 16d | 1 | 0.65mi |
| 2302 Leon St #7 Austin, TX | — | 1.0 | 350 | $1,500 | $4.29 | 23d | 1 | 0.69mi |
HOA detail condo
- Monthly dues
- $530 · $6,360/yr
- Likely covers
- watergaselectric
- Assessments
- None detected in remarks — confirm with the listing agent.
Listing history 26 events
-
2026-06-18days on market $184,000 Active 107 DOM
-
2026-06-17days on market $184,000 Active 106 DOM
-
2026-06-16days on market $184,000 Active 105 DOM
-
2026-06-15days on market $184,000 Active 104 DOM
-
2026-06-13days on market $184,000 Active 102 DOM
-
2026-06-09days on market $184,000 Active 98 DOM
-
2026-06-08days on market $184,000 Active 97 DOM
-
2026-06-07days on market $184,000 Active 96 DOM
-
2026-06-05days on market $184,000 Active 93 DOM
-
2026-06-03days on market $184,000 Active 92 DOM
-
2026-06-02days on market $184,000 Active 91 DOM
-
2026-06-01days on market $184,000 Active 90 DOM
-
2026-05-31days on market $184,000 Active 89 DOM
-
2026-03-10historical $1,395
-
2026-03-03$184,000 Active 402-char remark
Show marketing remark (402 chars)
Magnificent Affordable Midrise bordering the University of Texas and Downtown. Open floorplan with custom ceramic tile through out with upgraded kitchen and bath with Maple Cabinets, Granite Counters, and Stainless Appliances. Secured Entry and Parking. HOA dues cover Electric, Water, Hot water, and Gas. One Block from the UT Campus and 5 blocks to the Capital. Building is on a land lease till 2065.
-
2025-10-31$1,395
-
2020-11-02Active
-
2008-05-15soldstatus
-
2008-05-15historical
-
2007-05-31$114,900
-
2003-12-03soldstatus
-
2003-12-01$63,950
-
2003-12-01historical
-
2003-09-26
-
2003-09-01historical
-
2002-11-01
ⓘ Source: listings_history table (triggers on properties + properties_extension) + one-shot
backfill from property_details.listing_events for pre-trigger history.
Climate risk First Street
- Flood 1/10 Low FEMA zone X (unshaded) · 0% chance over 30 yrs
- Wildfire 1/10 Low
- Heat 8/10 Severe 7 d/yr ≥108°F today · 22 d/yr by 30 yrs out
- Wind 8/10 Severe 80% chance of damaging wind over 30 yrs
- Air quality 2/10 Low 1 unhealthy d/yr today · 1 by 30 yrs out
Nearby sold comps map
Loading sold comps map…
Walkable amenities ~0.75 mi
Loading nearby amenities…
Taxation est. · year 1
- Rental income
- $19,678
- − Mortgage interest
- −$10,307
- − Property taxes
- −$2,760
- − Insurance
- −$920
- − Repairs & maintenance
- −$1,574
- − Management
- −$1,574
- − HOA
- −$6,360
- − Depreciation
- −$5,353
- Taxable loss
- −$9,170
- Est. tax savings @ 24.0%
- +$2,201
- After-tax cash flow
- $-3,873/yr
For passive investors: Depreciation is non-cash, so a rental often shows a tax loss while cash-flowing — sheltering income. Rental losses are passive: they offset passive income freely, and up to $25,000/yr can offset ordinary (W-2) income if you actively participate and your MAGI is under $100k (phasing out to $0 by $150k); unused losses carry forward. On sale, claimed depreciation is recaptured at up to 25%, and gains may owe capital-gains tax (a 1031 exchange can defer both). Figures are a year-1 estimate at your 24.0% rate — not tax advice; consult a CPA.
Schools (NCES district)
- District
- Austin ISD
- NCES district ID
- 4808940
- Math proficiency
- 33% ▼ -19.00%
- Reading proficiency
- 44% ▼ -7.00%
- Median HH income
- $54,627
- Composite
- 33.65/100
- National rank
- #5397
- State rank
- #431 of 826 in TX
Livability — Austin
- Score
- 82/100
- State rank
- #16
- US rank
- #1208
Category grades
Schools grade is shown separately in the Schools card above.
Census & demographics
- Census place
- Austin, TX
- County
- Travis County · 1,299,254 people
- City population
- 1,066,854
- Metro
- Austin-Round Rock-Georgetown, TX
- Population (ZIP)
- 11,824
- Household income
- $162,168
- Rent vs Own
- Severe rent burden
- 678.0
Population outlook (Travis County) Hauer SSP2
- Today (2025)
- 1,545,133 people
- By 2030
- 1,729,269 · +11.9%
- By 2040
- 2,097,596 · +35.8%
- By 2050
- 2,463,890 · +59.5%
- By 2075
- 3,249,374 · +110.3%
- By 2100
- 3,801,868 · +146.1%
Race, ethnicity, and origin ACS 2023
- Neighborhood character
- Predominantly White (68%)
- Race & ethnicity
- White 68% Hispanic / Latino 17% Two or more races 12% Asian 6% Black 3%
- Hispanic origin (detail)
- Mexican 10%
- Common ancestry
- Lithuanian 4% Romanian 4% Slovak 3%
- Foreign-born
- 13% · Canada, China, Dominican Republic
- Languages at home
- 83% English-only · Spanish 10% Other Indo-European 3% Chinese 1%
Political lean MEDSL · Travis
- 2024 margin
- Solid D (+39.3) · D 68.8% · R 29.4% · Other 1.8%
- 2008→2024 swing
- +9.9pp toward D · 2008: 29.4pp · 2024: 39.3pp
- All cycles
- 2024: D+39.3 2020: D+45.0 2016: D+38.9 2012: D+23.9 2008: D+29.4
Not yet ingested
- Civics
- —
Market trends
- HPI YoY
- ▼ -0.46%
- Current HPI
- 183.8877
- Rent YoY
- ▲ 2.54%
- Metro
- Austin-Round Rock-Georgetown, TX
- State GDP YoY
- ▲ 3.95%
- F500 in state
- 110
Industry mix (Fortune 500 HQ in TX)
| Industry | F500 HQs | Revenue |
|---|---|---|
| Energy | 16 | $1,198B |
|
||
| Technology | 5 | $198B |
|
||
| Engineering / Construction | 4 | $72B |
|
||
| Energy Services | 3 | $60B |
|
||
| Utilities | 3 | $41B |
|
||
| Healthcare | 2 | $330B |
|
||
Price history
-97.8% since first listed13 events — show timeline
- 2026-03-10 Rental Removed $1,395 ACTRIS
- 2026-03-03 Listed $184,000 Unlock MLS
- 2025-10-31 Listed for Rent $1,395 ACTRIS
- 2020-11-02 Listed — Unlock MLS
- 2008-05-15 Delisted — Unlock MLS
- 2008-05-15 Sold (MLS) — Unlock MLS
- 2007-05-31 Listed $114,900 Unlock MLS
- 2003-12-03 Sold (MLS) — Unlock MLS
- 2003-12-01 Delisted — Unlock MLS
- 2003-12-01 Listed $63,950 Unlock MLS
- 2003-09-26 Listed — Unlock MLS
- 2003-09-01 Delisted — Unlock MLS
- 2002-11-01 Listed — Unlock MLS
Cash-flow waterfall
monthlySold comps — $/sqft
last 12 mo · ≤1 miLoading sold comps…